Merging files, Convert plot, Dialog box – Measurement Computing USB-5100 Series User Manual
Page 43: Converting units
USB-5100 Series Software Help
Modifying a Plot
Merging Files
This feature allows you to combine multiple data files into one file. Note that only series of the same type and
name can be merged and there cannot be an overlap in the time in the series.
1. Open the first file (oldest).
2. Select
File»Merge Datafile(s)
.
3. Select the data files you want to merge and click
Open
.
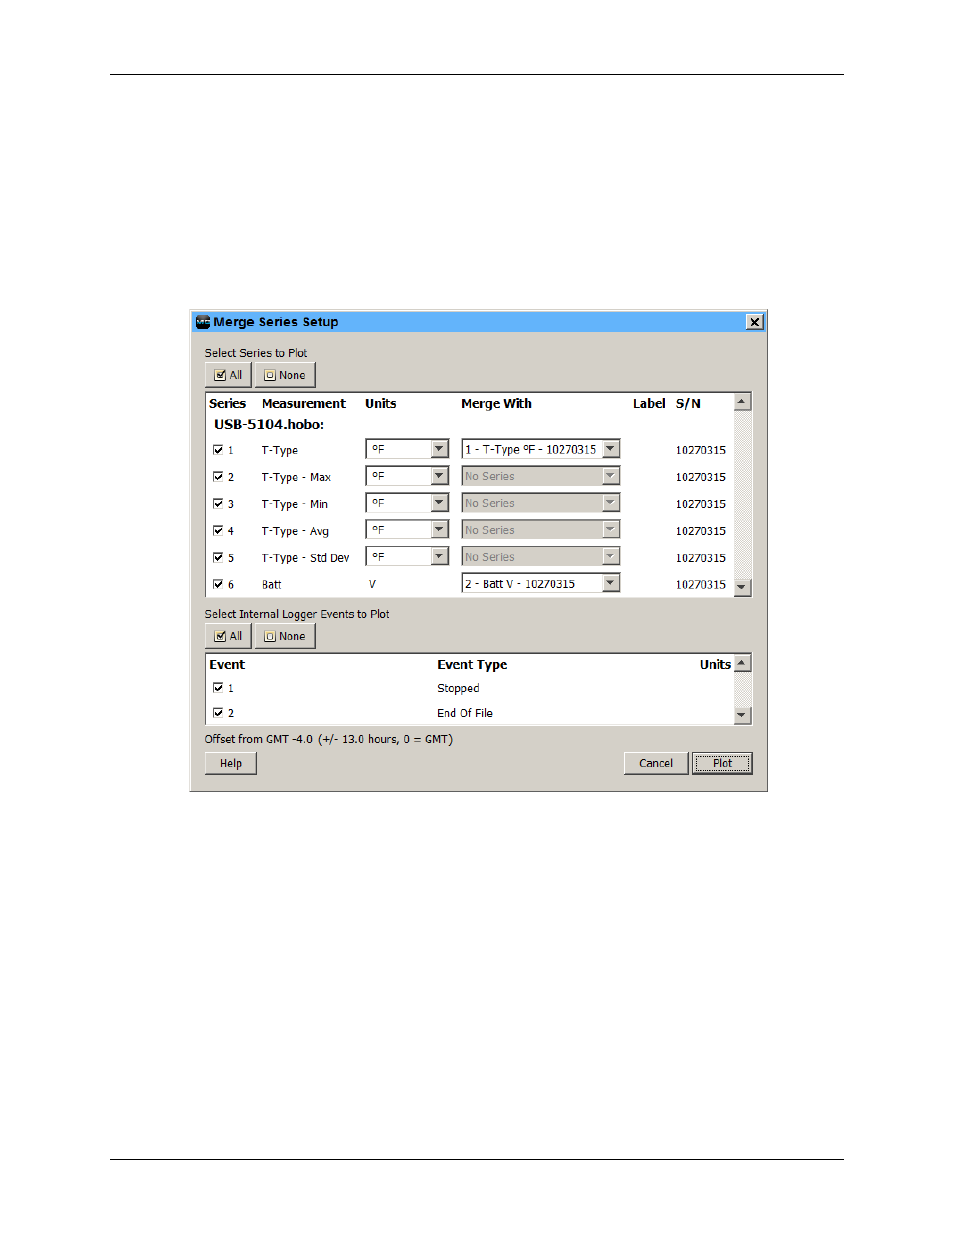
4. Select the series to plot. All series available in the selected data files are listed in the
Select Series to Plot
section. Select the checkbox to add or remove series as necessary, or select the
All
or
None
buttons in that
section to select all series or no series accordingly.
Figure 25. Merge Series Setup Dialog Box
5. All matching series available in the selected series are populated with the corresponding series listed in the
Merge With
column. Each new series can only be merged with the series of the same measurement type
and units. If no matching series is available in the plot, the
Merge With
column displays
No Series
for that
series. If a matching series is found, you can still append the series without merging by choosing
No Series
from the corresponding drop-down list in the
Merge With
column. The series is appended to the plot
without being merged with any series.
6. Select any internal logger events to plot, if applicable. Click the checkbox to add or remove each event as
necessary, or click
All
or
None
in that section to select all events or no events accordingly.
7. Click
Plot
to merge the selected series with their matching series. Save the new plot as a project file if
desired.
There may be gaps between the last sample in an older series and the first sample in the next.
After the series have been merged, the
Details Pane
is regenerated and the
Series Statistics
are recalculated.
The Points Table is regenerated and does show samples of both series in one column. The new logger
information is added to the Details Pane, showing the specific information about the different loggers that
collected the data samples.
43