Filtered series vs. statistics logging – Measurement Computing USB-5100 Series User Manual
Page 21
USB-5100 Series Software Help
Working with USB-5100 Series Data Loggers
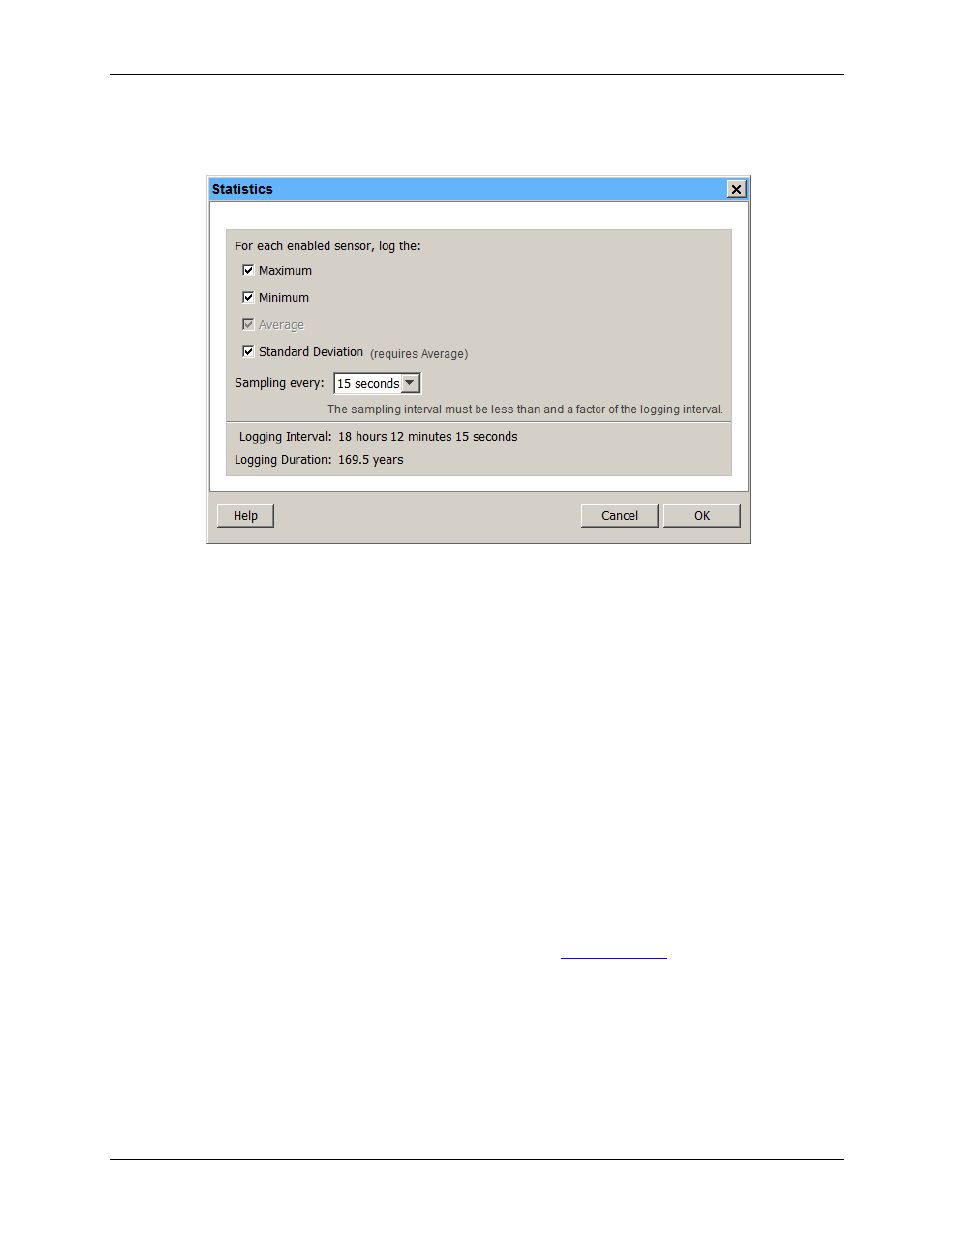
3. Configure the sampling interval, which must be less than and a factor of the logging interval. Choose either
a preset sampling interval or select
Custom
and enter your own sampling interval. Keep in mind that the
more frequent the sampling rate, the greater the impact on battery life.
Figure 10. Statistics Dialog Box
4. Click
OK
when done. This returns you to the
Launch Logger
dialog box. Click
Edit
next to
Logging Mode
in the
Launch Logger
dialog box to make additional changes.
Once logging begins, press the
Alarm/Stats
button on the logger for one second to cycle through the current
maximum, minimum, average, and standard deviation data (as applicable) on the LCD screen (it is not available
in the software Status dialog box). You can plot the statistics series once you read out the logger.
Filtered Series vs. Statistics Logging
USB-5100 Series loggers support filtered series and statistics logging, both of which involve calculating
maximum, minimum, and average values that you can plot after the logger is read out. Both are accessed from
the Launch Logger dialog box; for filtered series, click
Filters
and for statistics logging, select Statistics as the
Logging Mode. However, there are some key differences between the two features. Basically, statistics logging
is performed at the sampling interval of the logger, while filters include data accumulated from a series of
logged data points.
The following table compares filtered series to statistics logging so that you can choose the best solution for
your deployment.
Note:
There is also another filtering option available after you read out the logger, which is available from the
Filter button on the toolbar. This allows you to create filtered series based on the data in the plotted data file.
For more information about filtering after reading out a logger, see
21