Flowserve ValveSight Diagnostics User Manual
Page 30
ValveSight Diagnostics for HART User Manual FCD VSENSF0001-02-AQ 03/15
30
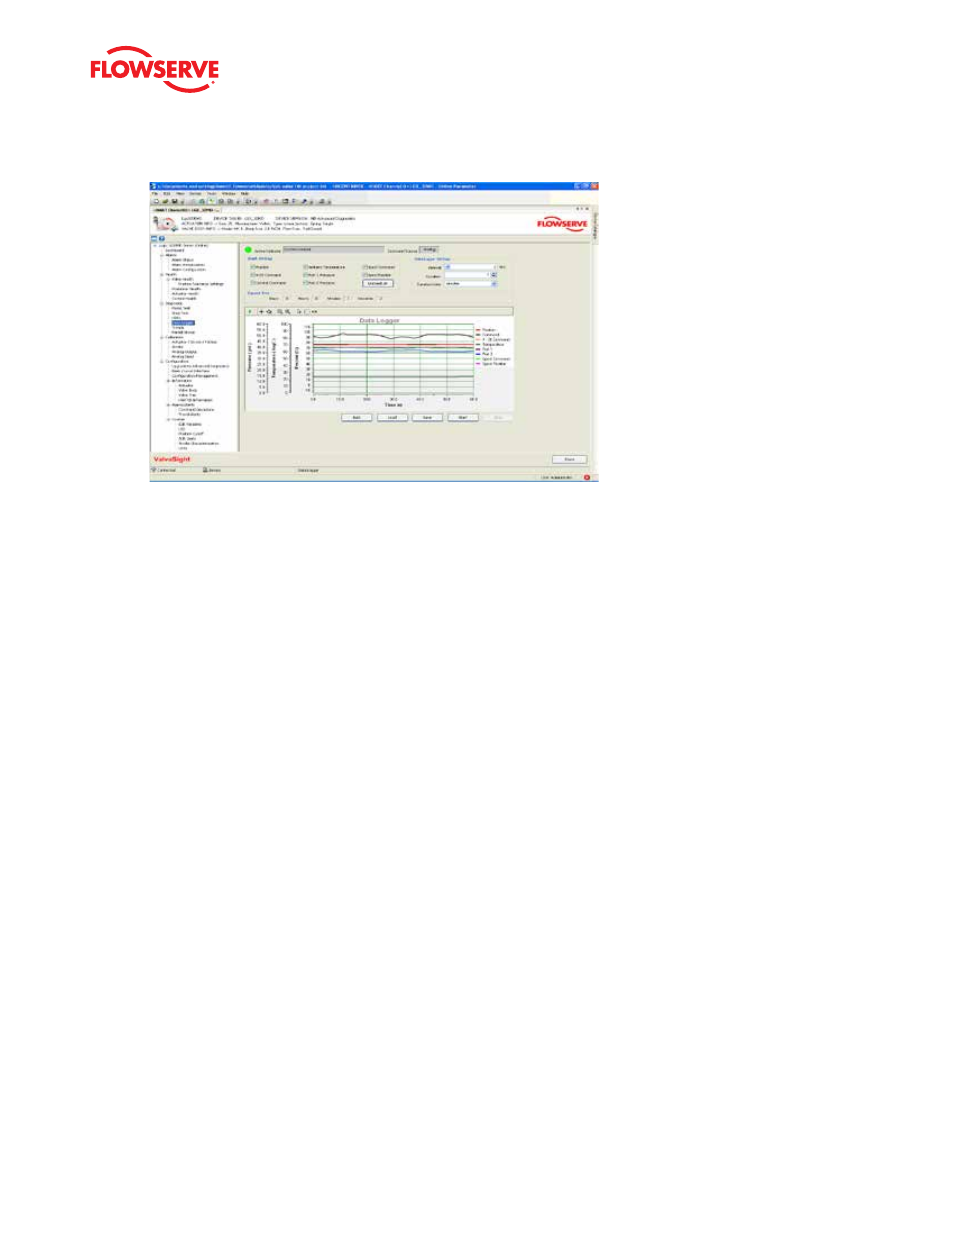
Graph Settings
The “Graph Settings” box allows the selection of the items to be shown on the graph. All the data is acquired regardless
of this setting. Any item can be hidden or shown after the data has been downloaded from the positioner. The
Uncheck All
button turns all the selections off. An explanation of some options are as follows:
• Position - The actual position of the valve
• Control Command - The characterized signal. The Position should match the Control Command. See the
Configuration>Custom>Stroke Characterization screen to change the stroke characterization.
• 4-20 Command - The analog input signal which can differ from the Control Command when in digital command
source mode.
Data Logger Settings
The “Data Logger Settings” box controls the timing and duration of the data collection. The Interval determines how often
data will be requested. The Duration and Duration Units selections determine how long the data will be gathered.
Elapsed Time
The elapsed time shows how long the data collection has been active.
Data Management
At the bottom of the screen, there are buttons to manage the signature data. You can
Save the data to a file, or Load
(retrieve) a previously stored signature from a file for viewing.
7.5 Trends
The purpose of this screen is to display data gathered over time. The data is stored on the device. Upon entering the
Trends screen, the data is automatically retrieved. The data is averaged as the period of time increases. For example,
the average of the data on the “24 Hours” chart will represent one point on the “30 Days” chart. The average for the “30
Days” chart will represent one point on the “12 Months” chart, etc. This way trends over long periods can be observed as
well as any short term deviations. This page is only available with the Advanced DTM used with a positioner that has been
upgraded with Pro diagnostics.