Flowserve ValveSight Diagnostics User Manual
Page 23

ValveSight Diagnostics for HART User Manual FCD VSENSF0001-02-AQ 03/15
23
flowserve.com
Adjusting the Graphs
At the top of each graph window there are several controls for viewing the graph.
• Resume - Returns the graph to the original scale
• Scroll - Allows you to use the cursor to scroll the axes, moving the location of the data on the chart.
• Zoom - Allows you to use the cursor to zoom the axes.
• Zoom In - Zooms in the whole graph.
• Zoom Out - Zooms the whole graph out.
• Zoom Box - Allows you to select any area of the graph. The selected area will be magnified to fit the chart.
• Cursor - Allows you to find precise values for the data displayed. Select the Cursor button, then select the data
series you wish to examine from the legend at the right of the graph. It will have an indicator which shows precise
values from the appropriate scale on the left. Use your mouse to drag the cursor to the desired position.
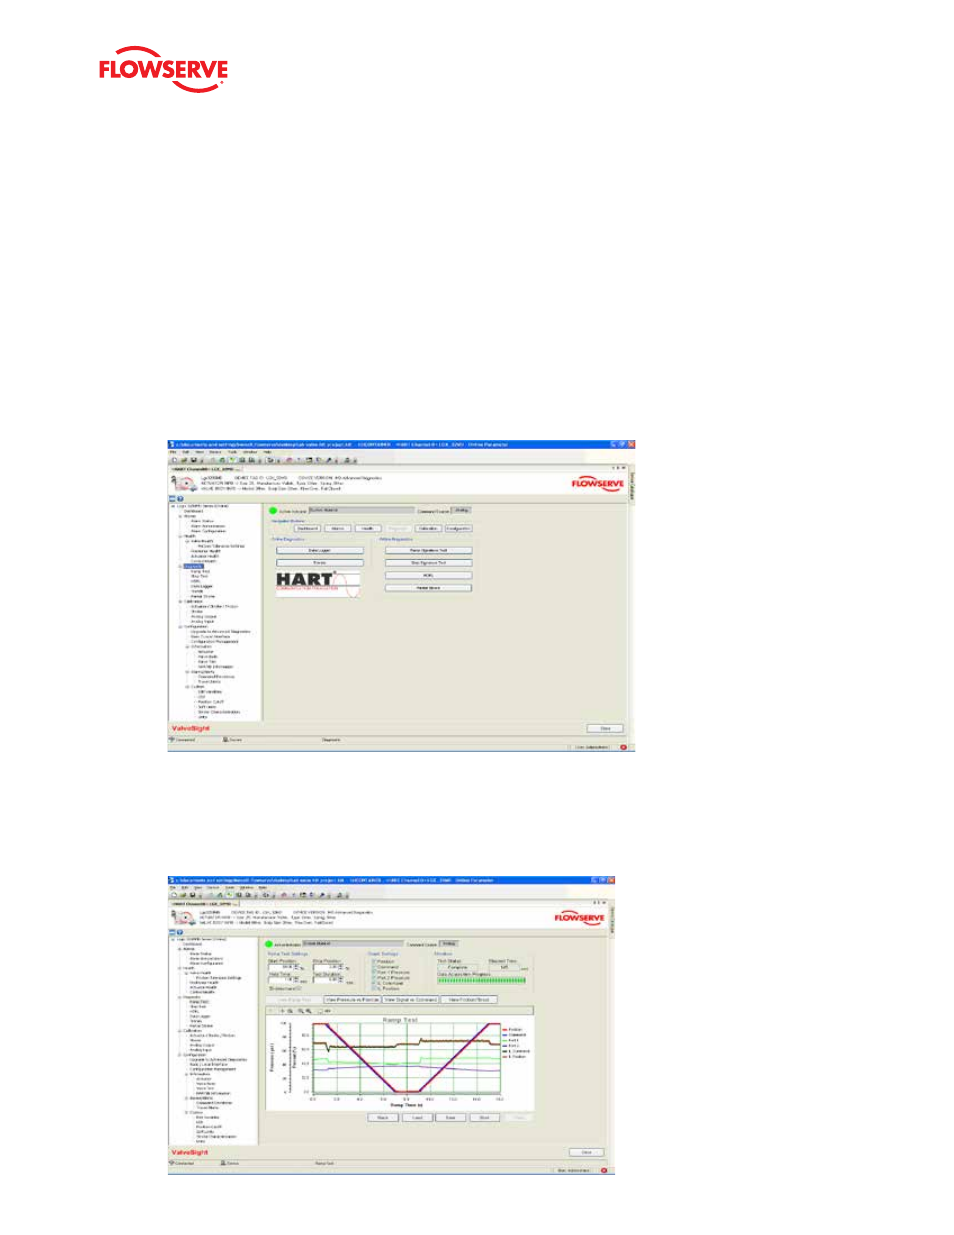
7.1 Ramp Test
Ramp Tests are a powerful tool for bench testing valves in a shop or installed valves that are not in service and can be
fully or partially stroked. By ramping up the valve with a known input and monitoring the response, you can note changes
over time and pinpoint problems that are developing or existing.
