Section 6: creating reports, 1 in-game reports, 2 shot chart printouts – Daktronics DakStats Soccer User Manual
Page 33: Section 6, Creating reports, In-game reports, Shot chart printouts
Creating Reports
27
Section 6:
Creating Reports
DakStats Soccer allows users to view and print a wide variety of reports to help assess player and
team statistics. The reports are produced as HTML files for easy transfer and email.
6.1 In-Game Reports
Users are able to print game reports when a game
is finished or while it is still open.
Note: By “print” it is meant that the reports
are generated as HTML files that can be
opened in an Internet browser and then sent
to a printer.
To print in-game reports:
1. Go to File > Print In Game.
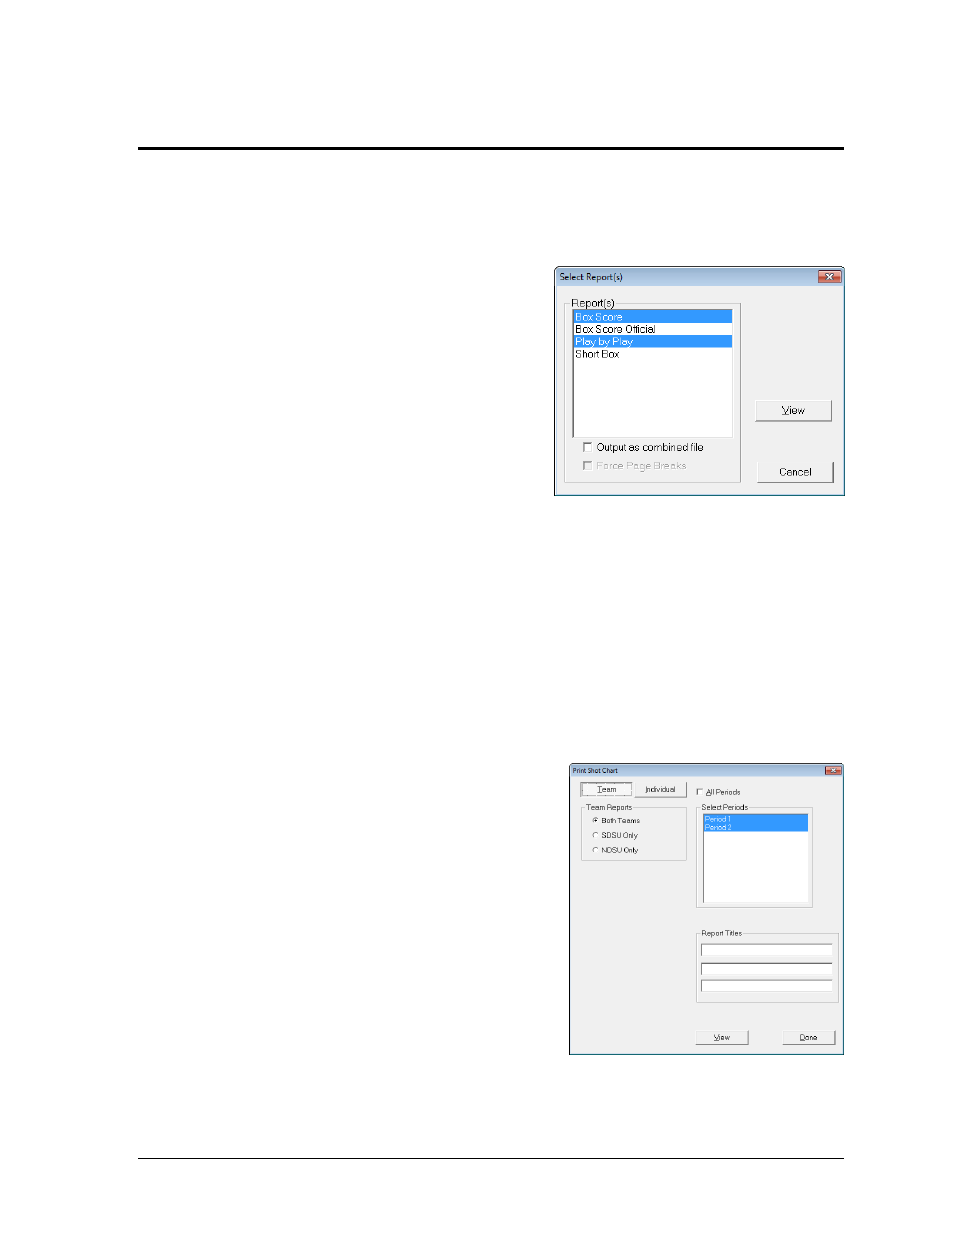
2. In the Select Report(s) window (Figure 30),
check one or more of the report types.
3. Selecting Output as combined file will show all reports on a single page. Combined
reports will also have links back to the top of the page under each section. Enable
Force Page Breaks to ensure each report appears on its own sheet of paper when
printed out.
4. Click View to open the report(s) in the default Internet browser, or click Cancel to
avoid creating the report(s).
5. Typically, going to File > Print within the Internet browser will create a hardcopy
printout of the report.
6.2 Shot Chart Printouts
Users are able to print the shot charts from each
period or the entire game (Play-by-play mode only).
To print a shot chart:
1. Go to File > Print Shot Chart.
2. In the Print Shot Chart window (Figure 31),
select the periods to print.
Note: Check the All Periods checkbox to
select every period.
3. Select Team or Individual reports. Select
specific player(s) as needed.
4. Enter descriptive Report Titles.
5. Click View to open a shot chart in the
default Internet browser.
6. Typically, going to File > Print within the Internet browser will create a hardcopy
printout of the report.
7. Click Done when finished.
Figure 30: Selecting Reports to Print
Figure 31: Print Shot Chart Window