Casella CEL Software for the Microdust dust monitor User Manual
Page 37
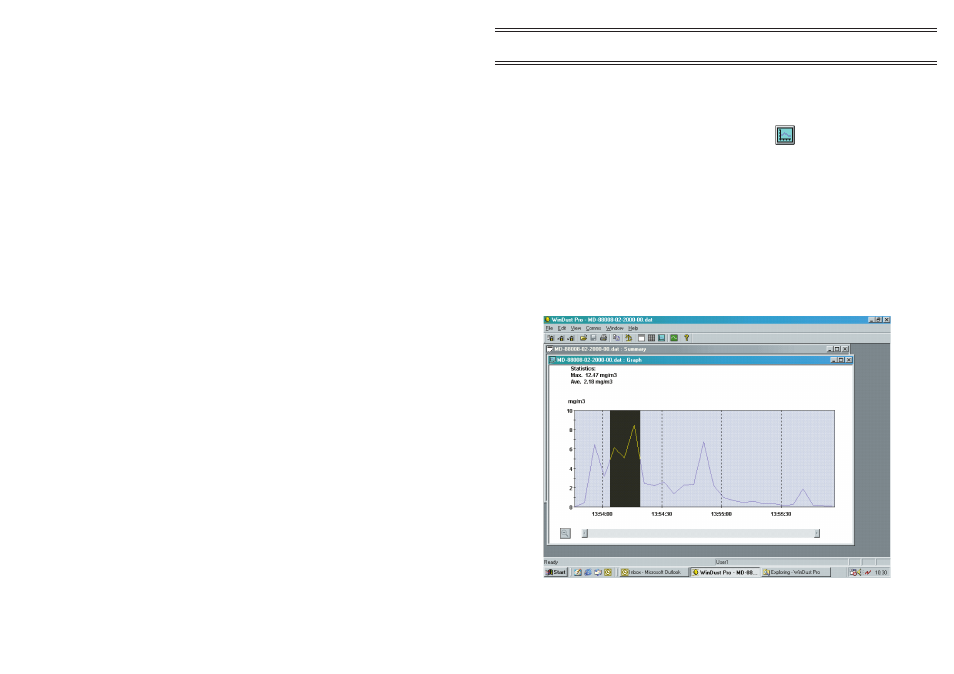
3.5.2 Displaying Data as a Graph
1.
Open the file you want to display as a graph, as described in
Section 3.5.1.
2.
Select
Graph
from the
View
menu or click
.
The graph will be displayed as shown in Figure 15. Both axes of the
graph are scaled automatically to cover the full range of dust
concentrations stored and the entire time period contained in the
data file.
3.
To enlarge a section of the graph for closer inspection, position the
mouse pointer at the point on the time axis where you want the new
display to start.
4.
Hold down the left mouse button while dragging to the right until
the highlighted portion covers the section of the graph you want to
expand.
Figure 15: The Graph window with a portion marked for expansion
Note:
The peaks shown on the graph are averaged over the logging interval and
in consequence may be different from the maximum instantaneous value
shown in the corresponding summary.
Page 37 of 60
Application
Software
MICRODUST pro Aerosol Monitoring System &
WINDUST pro Application Software - Handbook