Section event table – EXFO FTB-5600 Distributed PMD Analyzer User Manual
Page 69
Managing Results
Distributed PMD Analyzer
63
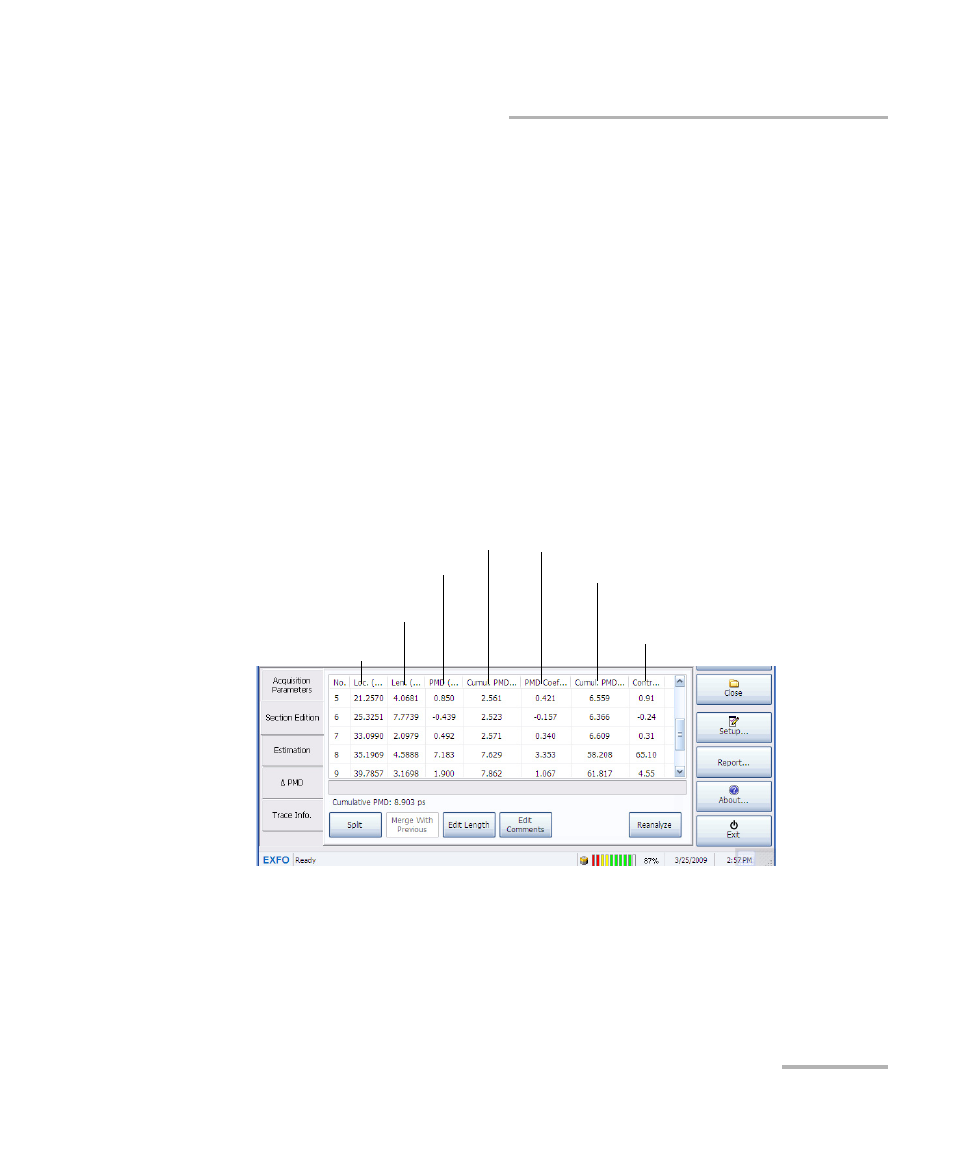
Section Event Table
Section Event Table
After the acquisition is complete, you can see that a trace and a curve
appeared on-screen. They are the OTDR trace, and the cumulative PMD
curve. The latter is computed from a set of data that is called an SOP (state
of polarization). Several SOPs make one final cumulative PMD curve.
In order to interpret the measurements in the section table corresponding
to the PMD curve and working with them, you must take into account that
the PMD curve is square rooted. This means that the PMD value for each
section is the square root difference of the PMD cumulative curve section’s
last value and the PMD cumulative curve section’s first value.
Several indicators in the cumulative PMD table will help you with your
measurements :
You will also notice the cumulative PMD value at the bottom of the table.
This is particularly useful when you have many sections in your FUT and do
not want to go up and down the table constantly between operations to
see the cumulative value.
PMD characteristics of of one
particular length of fiber
Squared PMD contribution to the
total cumulative PMD value of the
section to the link
Squared cumulative PMD value
Value of the cumulative PMD
curve at the end of the section
Computed PMD value of the section
Distance between the beginning and
end of the section
Beginning of the section