D-Link DFE-580TX User Manual
Page 15

DFE-580TX Fast Ethernet Server Card Manual
15
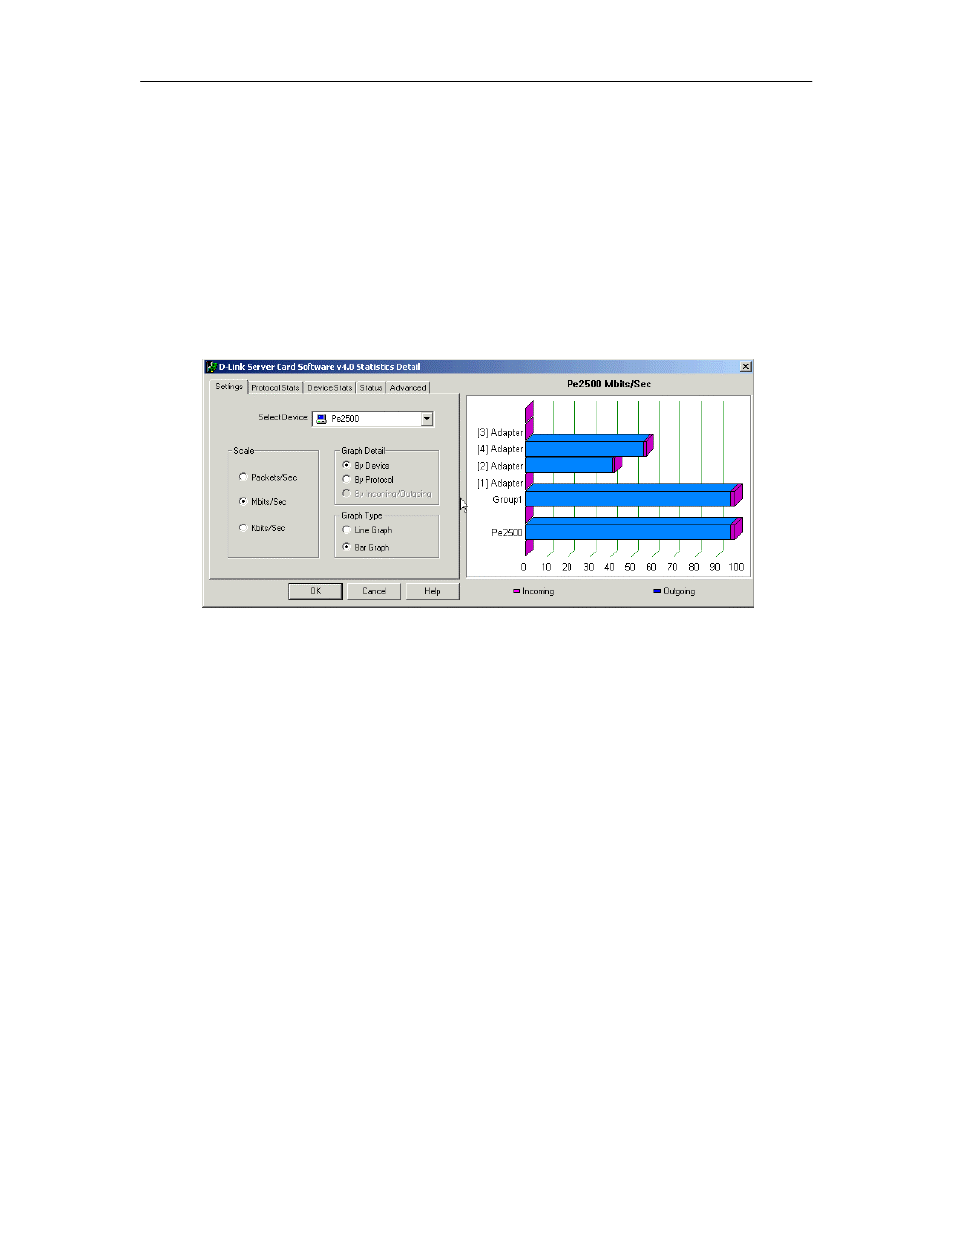
D-Link Server Card Software also provides the ability to view detailed traffic statistics in real-
time graphs and reports. The Settings tab allows you to customize how D-Link Server Card
Software graphs and displays throughput data, as well as select which device to graph
throughput data on. On this tab you can:
•
Change the scale to Packets/Sec, Mbits/Sec or Kbits/sec.
•
Further break out data by Incoming/Outgoing data, per adapter, or by protocol.
•
Select between Bar Graph and Line Graph.
•
Select the device whose data you wish to graph.
Scale
To change the scale of any chart or graph, simply selected the appropriate option under Scale
on the Graph Settings Tab. With D-Link Server Card Software you can switch the scale from
Packets per second, Megabits per second or Kbits per second.
Graph Detail
Graph Detail allows you to select how throughput totals are broken out for the currently
selected device. You can choose to display breakout detail in three ways:
•
By Device - Allows you to view throughput from all of the sub-components that make up
a device. For instance, if the currently selected device is a Group (Array), then breakout
totals will be displayed for each adapter that makes up that group.
•
By Protocol - This option allows you to view totals for each protocol running on the
currently selected device in addition to the total throughput of the device.
•
By Incoming/Outgoing - This option allows you to view total incoming traffic to the
device selected, total outgoing traffic in addition to the device’s total overall throughput.
NOTE:
This option is grayed out for Bar Chart type
graphs since both incoming and outgoing traffic
