Electrical characteristics curves – Delta Electronics Q48SP User Manual
Page 4
DS_Q48SP12017_05302008
4
ELECTRICAL CHARACTERISTICS CURVES
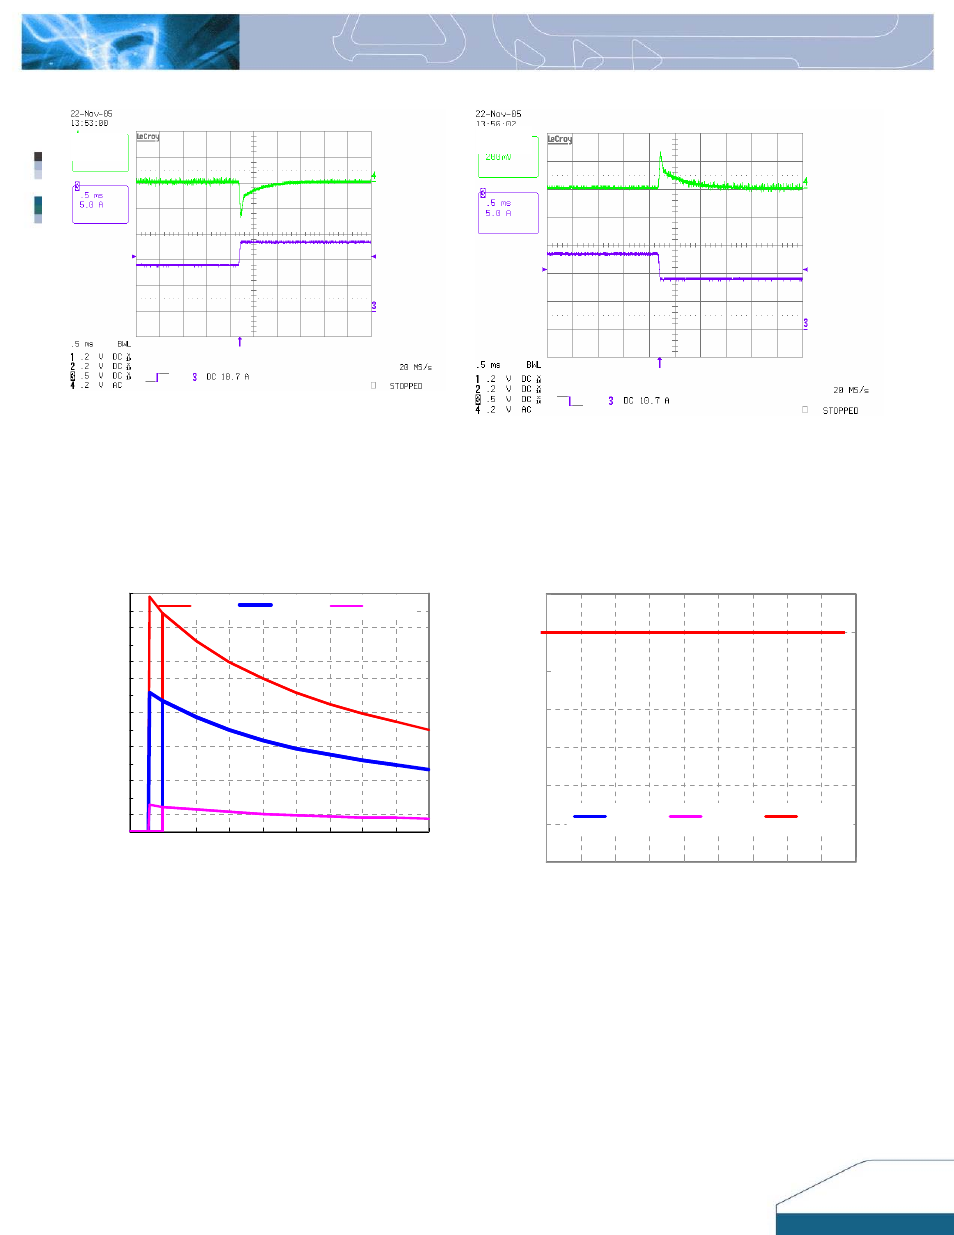
Figure 5:
Output voltage response to step-change in load
current (50%-75% of Io, max: di/dt =0.1A/µs). Load cap:1µF
ceramic capacitor and 10uF Tantalum capacitor. Top Trace:
Vout (200mV/div), Bottom Trace: Iout (5A/div). Scope
measurement should be made using a BNC cable (length
shorter than 20 inches). Position the load between 51 mm to
76 mm (2 inches to 3 inches) from the module.
Figure
6:
Output voltage response to step-change in load current
(75%-50% of Io, max; di/dt = 0.1A/µs). Load cap: 10uf tantalum
capacitor and 1µF ceramic capacitor. Top Trace: Vout
(200mV/div), Bottom Trace: Iout (5A/div). Scope measurement
should be made using a BNC cable (length shorter than 20
inches). Position the load between 51 mm to 76 mm (2 inches to
3 inches) from the module..
0.0
0.5
1.0
1.5
2.0
2.5
3.0
3.5
4.0
4.5
5.0
5.5
6.0
6.5
7.0
30
35
40
45
50
55
60
65
70
75
INPUT VOLTAGE (V)
INPUT CURREN (A)
Io=17A
Io=10.2A
Io=1.7A
0
2
4
6
8
10
12
14
0
2
4
6
8
10
12
14
16
18
LOAD CURRENT (A)
OUTPUT VOL
T
AGE (
V
) )
Vin=48V
Vin=36V
Vin=75V
Figure 7:
Typical input characteristics at room temperature Figure
8:
Output characteristics at room temperature