SmarTek Systems SAS-1 Setup Using SAS Monitor User Manual
Page 14
SmarTek Systems (www.smarteksys.com)
14
Set Detection Sensitivity for Each Lane
After setting up the SAS-1 detection
zones/lanes and the lane by lane detection
sensitivity, the speed estimate for each lane can
be calibrated. If the Start/Stop button on the
main SAS Monitor and Setup display shows
“Stop”, click the Stop button to stop the
current display activity. Now click in the upper
or lower part of the Mode display field to set
the SAS Monitor display to Mode 1 (TAI
display) and then click the Start button to start
the TAI display. Click the Settings/Speed
Calibration Window menu item. This opens
the Speed Calibration Window shown in
Figure 8.
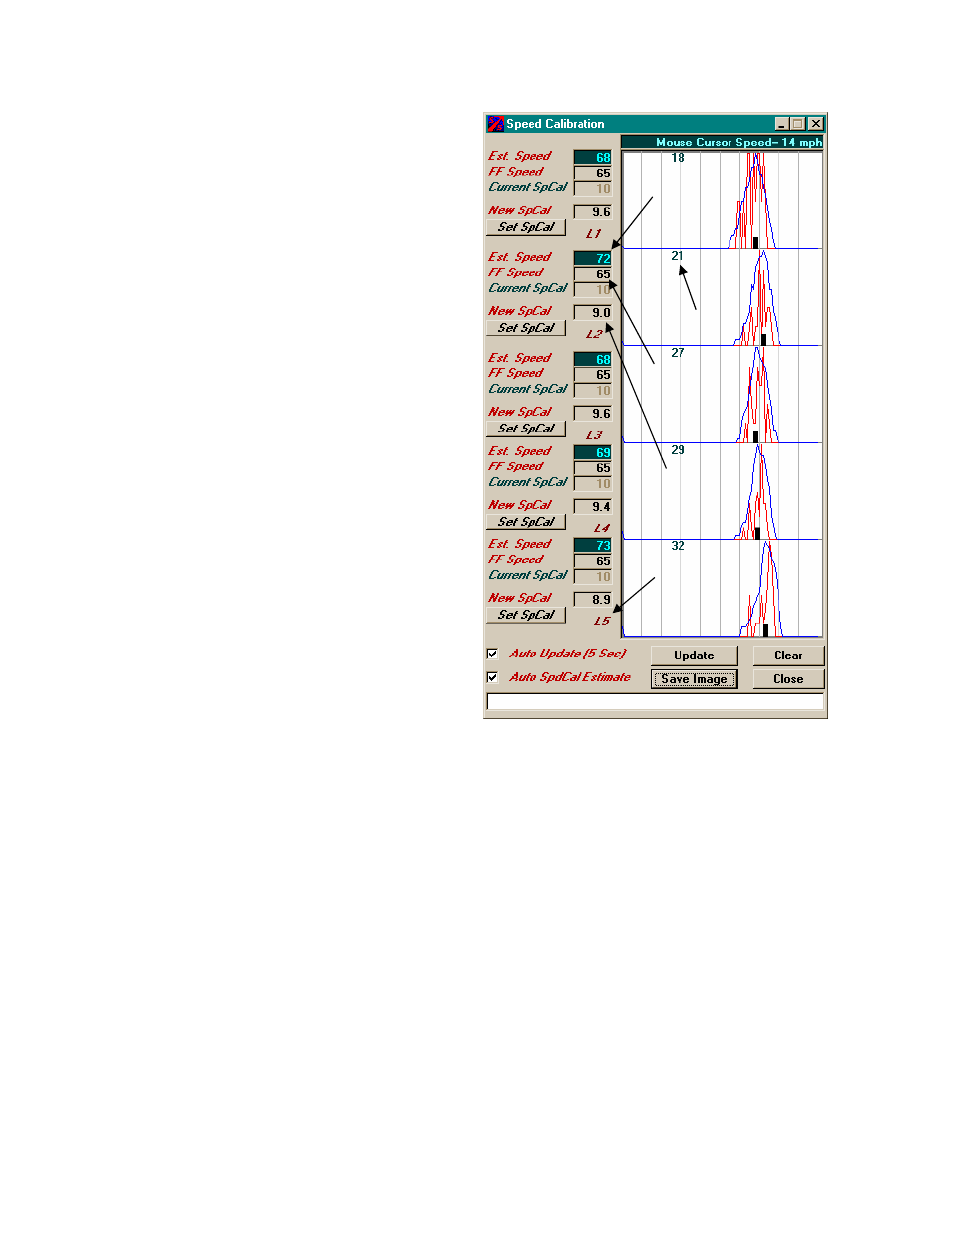
The plotting area in the Speed Calibration
Window shows the speed histogram plot for
each lane. The plotting area has 10 mph grid
lines from 0 mph to 100 mph. Move the mouse
pointer in the plotting area from side to side
and observe the speed readout above the
histogram plotting area. As the TAI display
runs, speed histogram data is continuously
collected. Click on the Auto SpCal Estimate
Check Box to enable the speed histogram
plots and automatic SpCal estimation. Let the
TAI display run for several minutes in order to
collect a significant number of speed samples
for each monitored lane. The raw speed
histogram data is plotted in
Red
. The data plotted in
Blue
shows the “smoothed” histogram
data.
With the Auto SpCal Estimate checked, SAS Monitor and Setup collects speed histogram data
as each vehicle is detected. The mean value (peak of the blue plot) of each speed histogram is
found and marked (black mark). From this value, the Specified Free Flow Speed, and the
Current SpCal value, the New SpCal value for each lane is calculated. These values are
displayed in the New SpCal field for each lane.
To transfer the automatically calculated New SpCal value for each lane to the SpCal fields on the
main SAS Monitor and Setup display, click the Set SpCal button for each lane. Note that when
these fields are updated, the Yellow Parameter Flag becomes visible. To complete the speed
calibration procedure, the updated SpCal values need to be sent to the SAS-1. Click the Stop
button to stop the TAI display. Click the Save Par button. After the Save Par button turns to
Figure 8 SAS-1 Speed Calibration
Current Speed
Estimate
Specified Free Flow
Speed
Lane Number
Calculated SpCal
Descriptive Text Area
# of Samples