SmarTek Systems SAS-1 Setup Using SAS Monitor User Manual
Page 10
SmarTek Systems (www.smarteksys.com)
10
For this display, it is important to understand the point of reference. Move the mouse pointer
slowly through the TAI display area from left to right. As the mouse pointer moves through, you
should see the green readout to the left of the
TAI display area change from Pixel=1 to
Pixel=181. If you where standing just behind
the SAS-1 (same end as the strain relief) to
your left would be Pixel=1 and to your right
would be Pixel=181 (Figure 3). As vehicles
pass by the SAS-1, they appear as the most
recent update. Vehicles which passed by
several seconds earlier, appear higher on the
TAI display. Hence, the top of the display
area shows the oldest vehicle acoustic signals,
while the bottom shows the newest vehicle
acoustic signals.
The total display time (vertical) is 30 seconds unless the SAS-1 baud rate is set to 19.2 Kbps or
less in which case the total TAI display time is 60 seconds for 19.2 K bps or 120 seconds for
9600 bps. Once the display reaches the bottom, it clears and starts again at the top. If the TAI
Scroll mode is active (click Settings/Scroll Traffic Acoustic Image(TAI)), the TAI display
builds (or scrolls) from the bottom up continuously and does not clear. The Scroll mode is the
preferred mode, however, it requires increased computer speed. This display continues until
stopped by the installer.
The green vehicle acoustic power “blobs”,
as they appear and fill the display, will
form “columns”. An occasional lane
switcher will appear to be “out of line”,
however, each “column” of green vehicle
“blobs” define each lane’s position. The
process of setting the detection zone
positions and sizes for the SAS-1 is based
on where the “columns” of vehicle “blobs”
are located. The SAS Monitor Lane
Finder Function integrates the acoustic
power data for the period specified in the
LPF display field (set this to 2 or 5
minutes for heavy traffic and to 10 minutes
or more for light traffic). At the end of the
Lane Finder integration period, the Lane
Finder Function is displayed (updated)
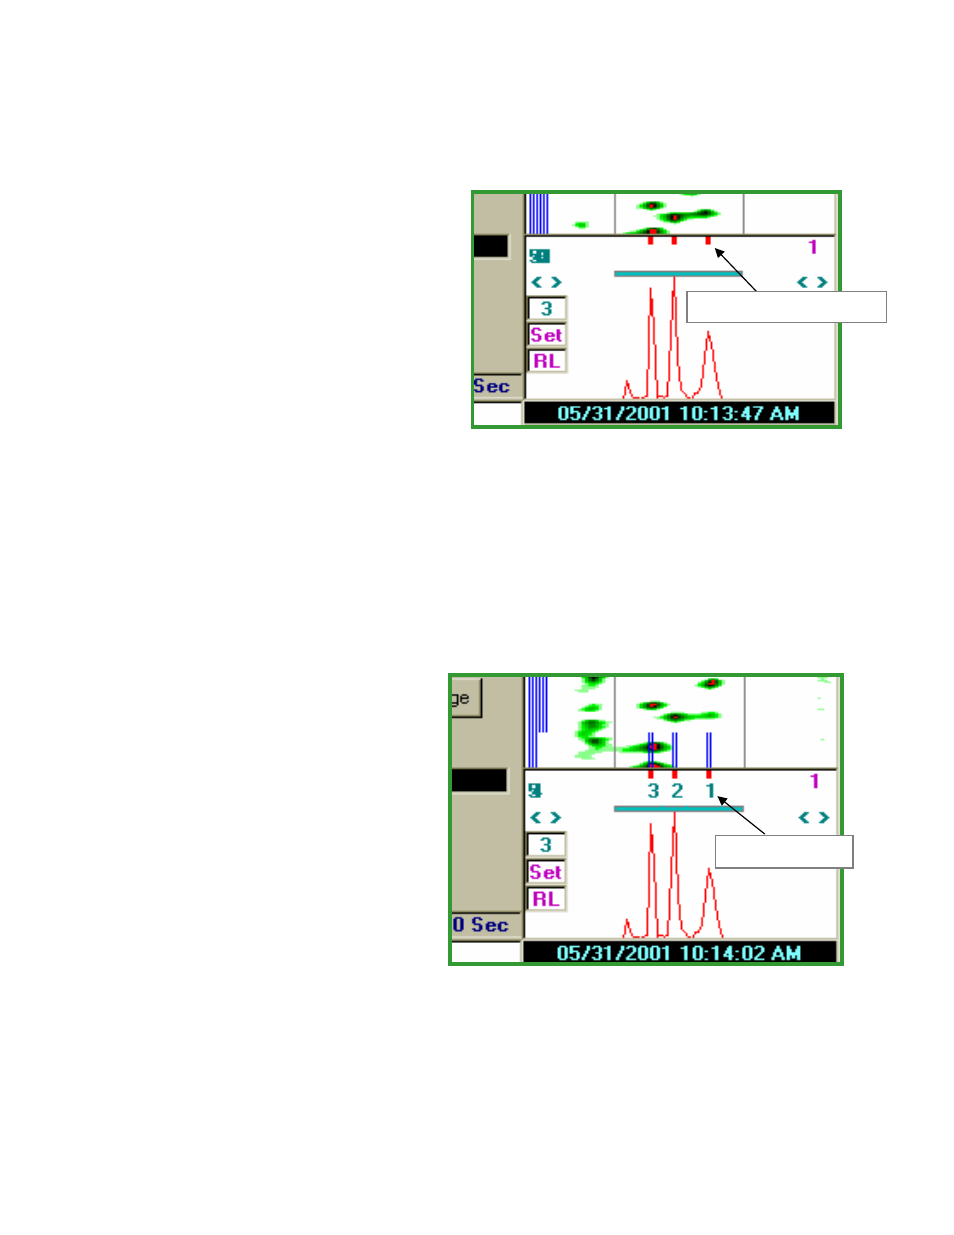
showing the red function with peaks and nulls (Figure 4). Also displayed or updated are red
indicators just below the TAI display area. These indicators show the lane or zone center
positions found by the Lane Finder Function. The time remaining for a Lane Finder update is
indicated in the field to the left of the Lane Finder Display area. Once the Lane Finder Function
Figure 4 Lane/Zone Position Indicators
Lane Position Indicator
Lane Numbers
Figure 5 Setting the Lane/Zone Center