Galaxy Audio CHECK MATE CM-160 User Manual
Page 18
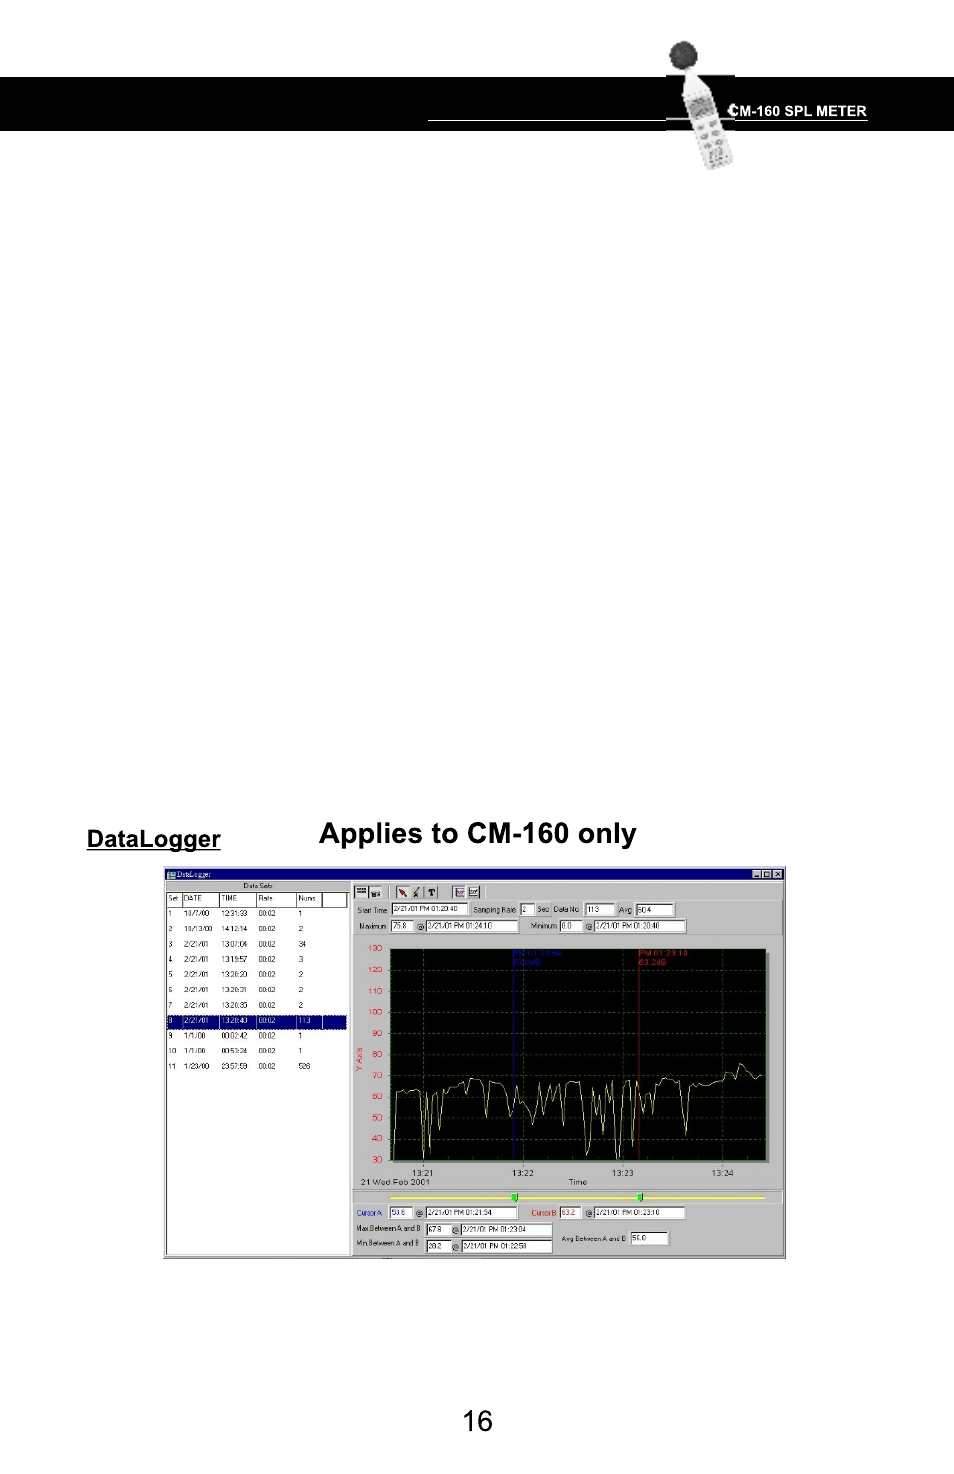
You can choose a rectanglular area on the graph to zoom into for detail.
There are two vertical lines (CURSOR A and CURSOR B)in the graph.
There are time and value displays on the top and the right side of each cursor.
You can move the mouse cursor over cursor A or B and click to drag the
cursor to the left or right. Right below cursor A and B is a slider. You can also
click and drag the slider to move cursor A or B. Below the slider are the
statistics that display start time, sampling rate, data number, and maximum
and minimum levels shown on the graph. The statistics also display the
maximum, minimum, and average between cursor A and B. This data updates
automatically when cursor A or B is moving.
You can double click the graph to call up the option dialog. In the option
dialog, the graph style can be customized.
You can right click on the graph (not available for real time graphs) to call
up the popup menu.
You can Zoom the graph by using the mouse:
To Zoom:
1. Press the left mouse button and drag the cursor to select the area
on which you want to zoom in.
2. Release the mouse button.
To Undo the Zoom - Right click on the graph to bring up the
pop-up menu. Select Undo Zoom .