English, Easy-link, Color-sample-link 3_illuminants – ALTANA Easy-Link Color-Sample-Link User Manual
Page 2: Data analysis lab-plot / color-trend, Spectralcurve
Measure what you see.
Additives & Instruments
A member of
BYK-Gardner USA · 9104 Guilford Road · Columbia · MD 21046 · USA · Phone +1-301-483-6500 · Fax +1-301-483-6555 · www.byk.com/instruments
ENGLISH
300 000 026 E 1203
•
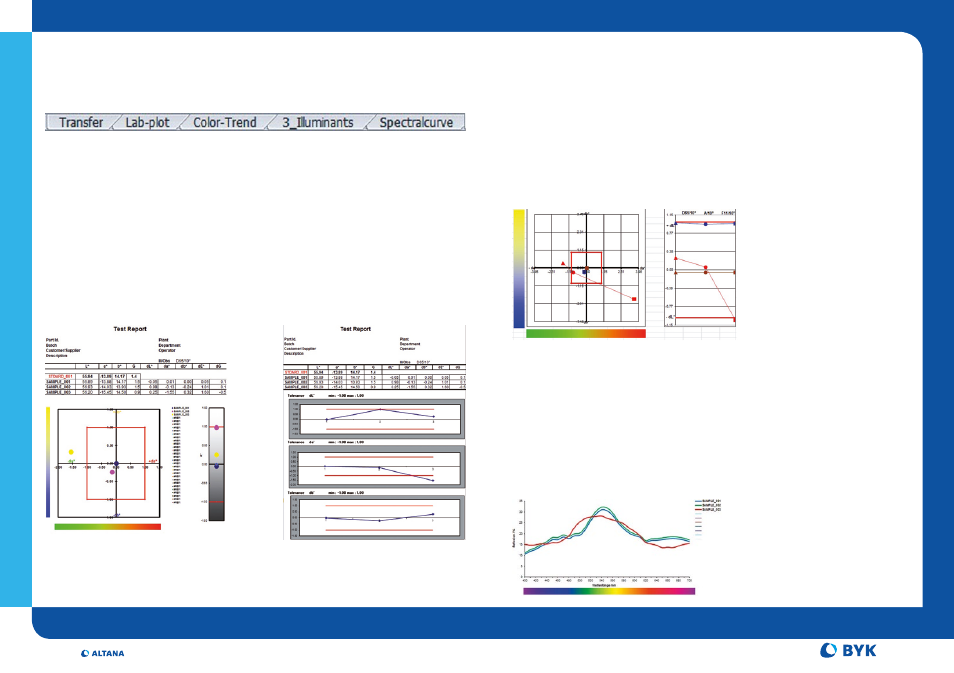
Color differences and metamerism index are displayed simultaneously
for three illuminants
•
Select standard, samples and illuminants with the
“Update“ button
•
Graphical display:
Samples
➔
different colors
Illuminants ➔ different symbols
easy-link
color-Sample-link
3_Illuminants
Selection of graphs is done by the worksheets.
Data Analysis
Lab-Plot / Color-Trend
•
Select standard with
„Standard“ button
•
Select sample with
„Sample“ button
Note:
Only samples compared to the selected standard
can be displayed.
•
Input of Tolerances can be done with the icon
„Tolerance“
•
To select a new standard, use
„Delete Sheet”
and select a new standard
•
„Lab-Plot“ shows,
whether all parts are
within specifications
•
„Color-Trend“ shows
changes over time
If the symbols are close together the samples are non-metameric.
Note:
Samples to be displayed must be compared to a standard
that is stored in the instrument.
Spectralcurve
•
Shows the spectral curve of different samples
•
Select samples with
„Sample“ button
•
Press
„Automatic“ or „100%“ to scale the graph