1 visualization – BUCHI SpeedExtractor E-916 User Manual
Page 18
6 Operation
18
SpeedExtractor Record 1.0 Operation Manual, Version A
6.4.1
Visualization
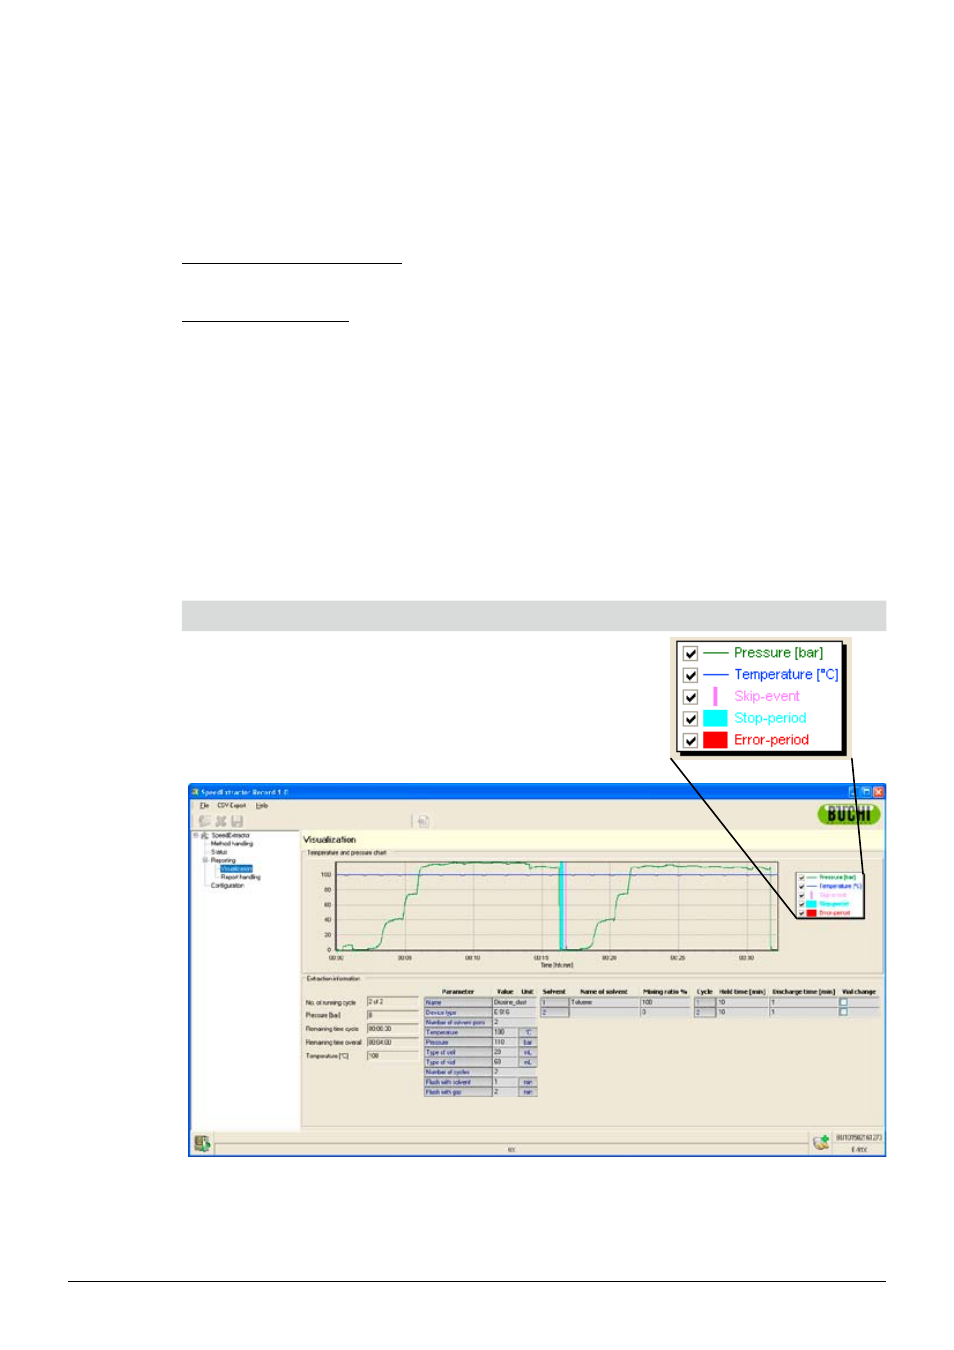
The ‘Visualization’ view displays a realtime pressure and temperature chart of the running extraction
process for recording. This includes any process interruption. It also shows details about the ongoing
extraction and its method.
Temperature and pressure chart
The legend in the upper right gives the corresponding colors and curve descriptions.
Additional chart features
Zoom-in feature:
Hold down the left mouse button and mark an area on the chart in a left-to-right, downwards
•
directed movement.
Release the left mouse button, the previously marked area will appear zoomed.
•
Zoom reset:
Hold down the left mouse button and drive the mouse-pointer in a right-to-left movement. This will
•
reset the zoom.
Scrolling feature:
Hold down the right mouse button and move the mouse pointer on the chart area to move the
•
chart freely.
Explanation
Chart legend
The chart (Fig. 6.5) shows all possible events, highlighted by colors. Use the
checkboxes at the chart legend on the left to show or hide the different curves
or events.
Fig. 6.5: Visualization screen
Note
This view is only visible when an instrument is connected and an extraction is in process.