Discussion of test results, Results of comparative analysis – ETS-Lindgren 5411 GTEM! Test Cell User Manual
Page 85
Radiated Emissions Test Performance of GTEM!
|
85
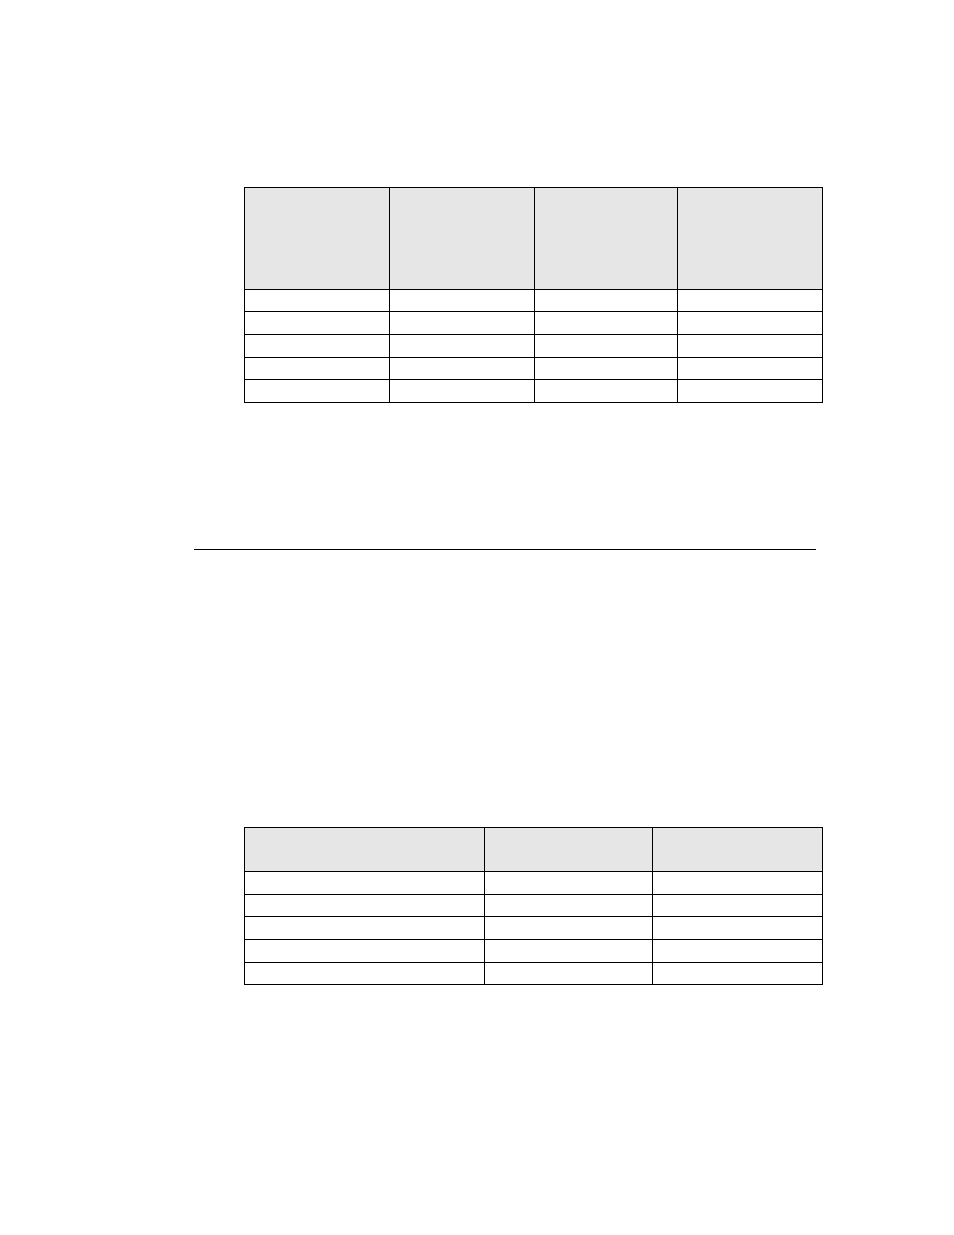
Table 8: Personal Computer System 2, OATS versus GTEM! at 3 Meters
The average difference between the GTEM! and the OATS is –0.19 dB and the
standard deviation is 2.10 dB.
Frequency
(MHz)
GTEM!
Computed Field
Strength
(dB uV/m)
OATS Measured
Field Data
(dB uV/m)
Difference
(dB)
140.0
28.74
27.5
+1.24
182.0
26.00
28.0
-2.00
185.0
30.20
28.6
+1.60
233.0
28.91
27.8
+1.11
320.0
24.69
27.6
-2.91
The data is summarized in Table 9 and Table 10 in the next section. Note that
this data was acquired with different instrumentation at different test sites using a
different GTEM!, therefore producing an independent set of data.
Discussion of Test Results
This section describes the results of the analysis performed on the data, and
provides commentary about the results.
R
ESULTS OF
C
OMPARATIVE
A
NALYSIS
The test series reported show good agreement between GTEM! measurements
and OATS measurements. It is interesting to note that the sets of dipole
measurements summarized in the following table show reasonably consistent
results.
Table 9: Summary of Dipole Measurements
Data Set
Average Difference
(dB)
Standard Deviation
(dB)
Dipole Data 1 at 3 Meters
-0.97
1.39
Dipole Data 1 at 10 Meters
-1.20
1.26
Dipole Data 1 at 30 Meters
-0.25
1.27
Dipole Data 2 at 3 Meters
-1.21
1.52
Dipole Data 3 at 3 Meters
+1.59
2.6