Personal computer testing – ETS-Lindgren 5411 GTEM! Test Cell User Manual
Page 84
84
|
Radiated Emissions Test Performance of GTEM!
P
ERSONAL
C
OMPUTER
T
ESTING
Test results for the testing of the two personal computer systems are shown in
the following tables.
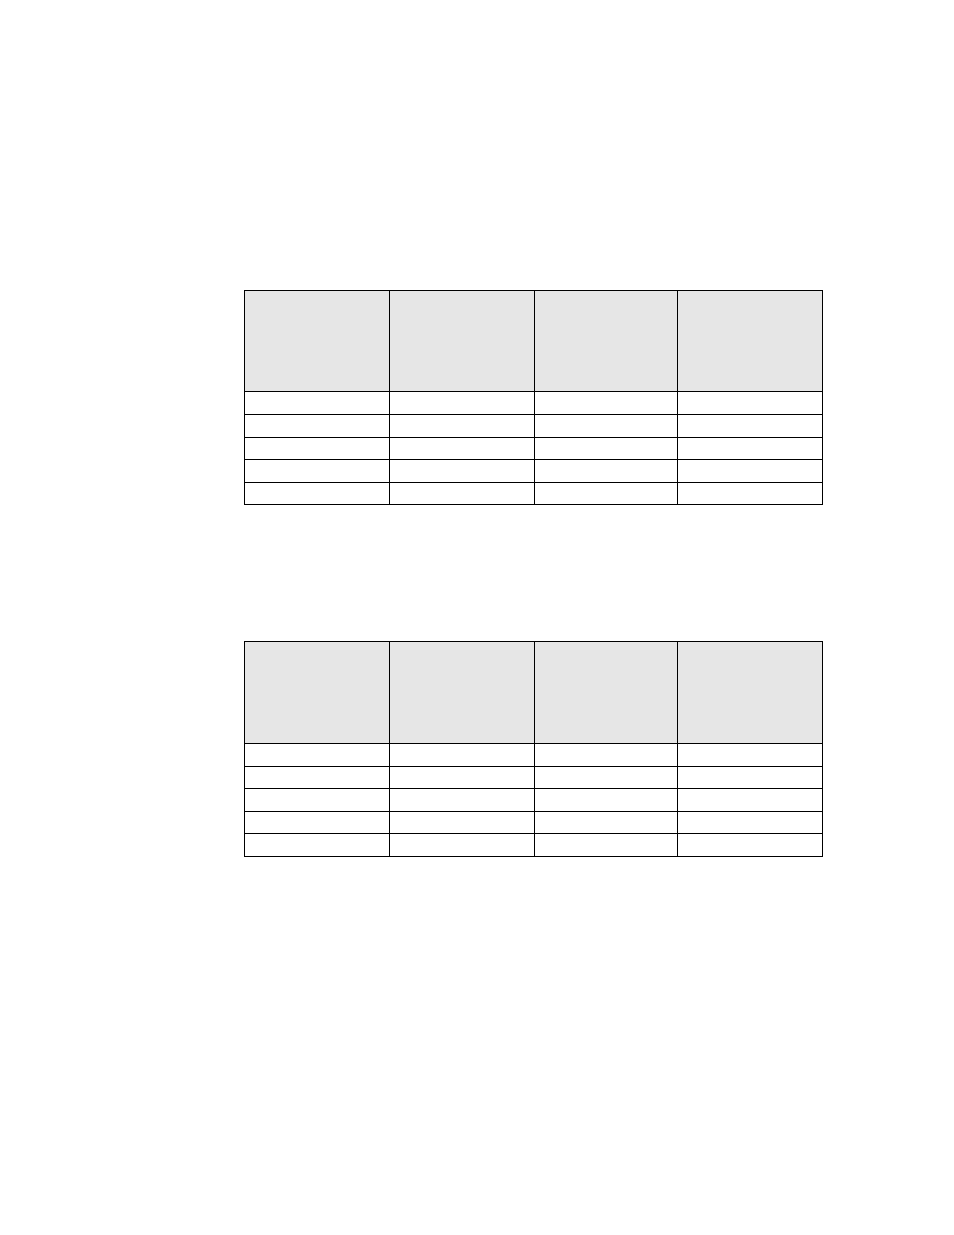
Table 6: Personal Computer System 1, OATS versus GTEM! at 3 Meters
The average difference between the GTEM! and the OATS is +3.18 dB and the
standard deviation is 3.85 dB.
Frequency
(MHz)
GTEM!
Computed Field
Strength
(dB uV/m)
OATS Measured
Field Data
(dB uV/m)
Difference
(dB)
35.32
64.4
63.6
+0.8
70.65
62.1
54.0
+8.1
141.5
45.2
45.2
+0.0
160.5
46.1
45.7
+0.4
186.1
45.0
38.4
+6.6
Table 7: Personal Computer System 1, OATS versus GTEM! at 10 Meters
The average difference between the GTEM! and the OATS is 2.18 dB and the
standard deviation is 4.57 dB.
Frequency
(MHz)
GTEM!
Computed Field
Strength
(dB uV/m)
OATS Measured
Field Data
(dB uV/m)
Difference
(dB)
35.33
54.4
57.7
-3.3
70.6
52.1
42.8
+9.3
141.6
35.2
34.2
+1.0
160.5
36.1
35.0
+1.1
186.1
35.0
32.2
-2.8