Design of data analysis, Direct comparisons, System unit monitor keyboard – ETS-Lindgren 5411 GTEM! Test Cell User Manual
Page 79
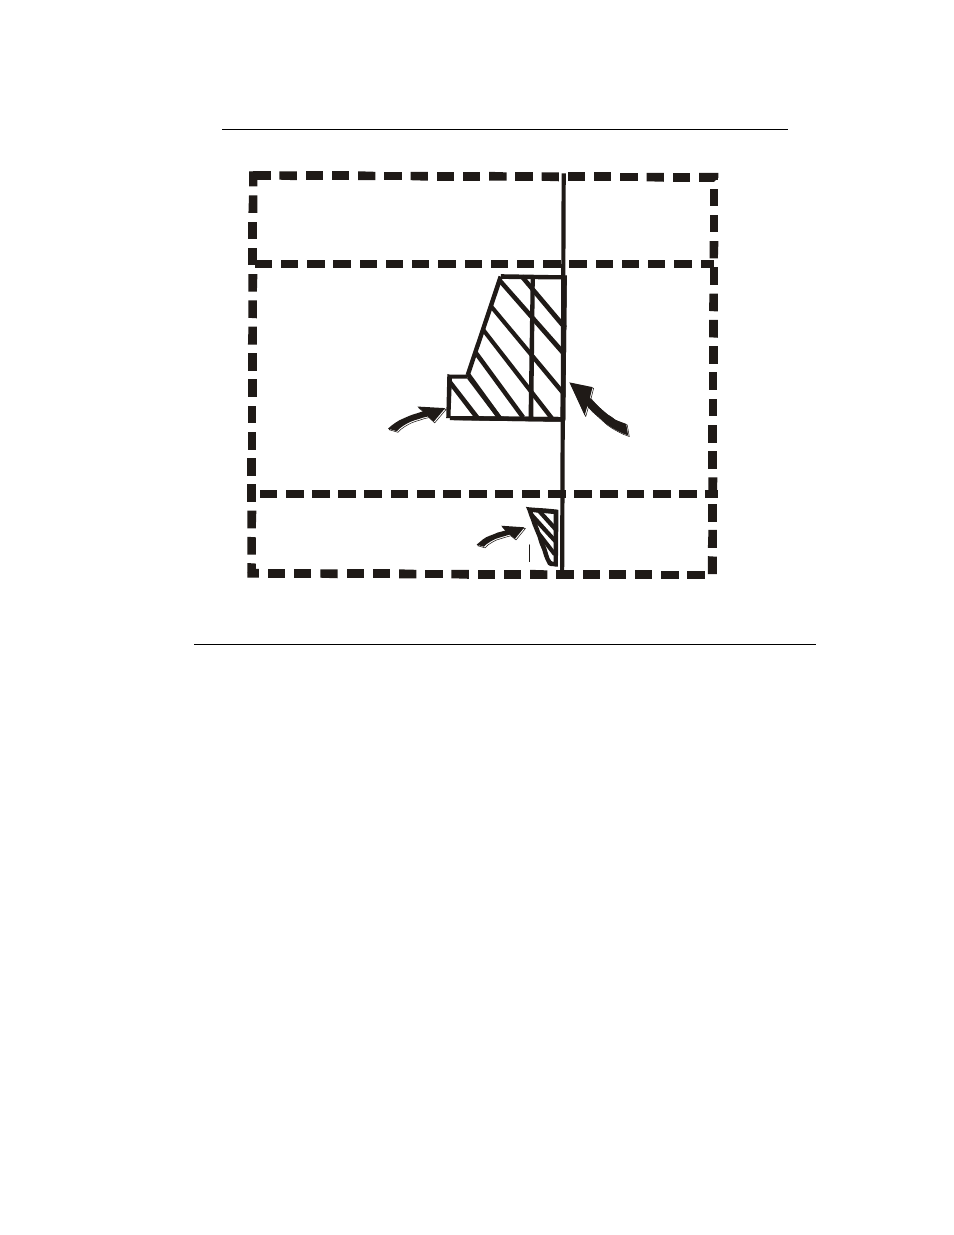
Radiated Emissions Test Performance of GTEM!
|
79
P
ERSONAL
C
OMPUTER
S
YSTEM
I
NSTALLED FOR
V
ZXY
M
EASUREMENT AS
S
EEN
F
ROM
A
PEX
Design of Data Analysis
The consideration of how to compare the data between the two types of test
facilities, the GTEM! and an OATS, is less straightforward than may seem.
Two types of analysis of the comparative data were performed: direct and
statistical comparisons.
D
IRECT
C
OMPARISONS
The first comparison of the data is the direct subtraction of the OATS
measurement of a signal at any frequency from the GTEM! measurement at the
same frequency. This gives a quantitative analysis of the direct difference of the
measurements. By subtracting the OATS reading from the GTEM! reading, a
positive value indicated that the GTEM! measured signal is larger than the
OATS measured signal. Conversely, a negative value indicates that the
GTEM! is measuring the emanation lower than the OATS.
The second direct comparison of the data is the determination of the mean and
standard deviation at the differences for all data points in a single data set.
System
Unit
Monitor
Keyboard