ETS-Lindgren 5411 GTEM! Test Cell User Manual
Page 82
82
|
Radiated Emissions Test Performance of GTEM!
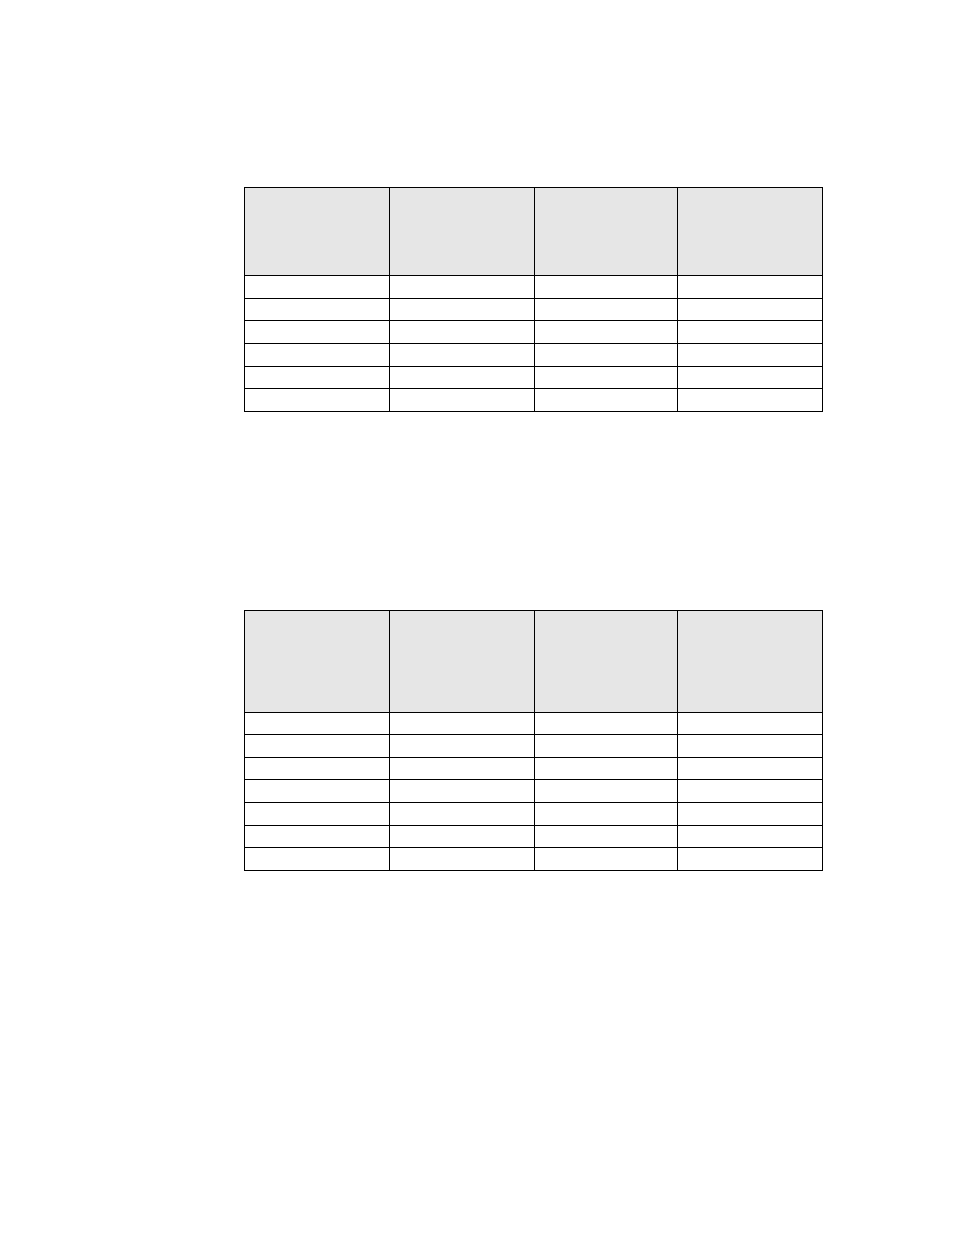
Table 3: Tune Resonant Dipole Measurements at 30 Meters
The average difference between the GTEM! and the OATS is –0.25 dB, and the
standard deviation is 1.27 dB.
Frequency
(MHz)
GTEM!
Computed Field
Strength
(dB uV/m)
OATS Measured
Field Data
(dB uV/m)
Difference
(dB)
500.0
83.7
83.2
+0.5
600.0
82.1
83.6
-1.5
700.0
81.9
84.4
-2.5
800.0
80.6
82.2
-1.6
900.0
82.5
84.8
-2.3
1000.0
84.1
83.9
+0.2
Table 4: Resonant Dipole Data, GTEM! versus OATS at 3 Meters
The second set of dipole measurements were made over the frequency range of
400 MHz to 1000 MHz. Tuned resonant dipoles were used for this testing.
The average difference between the GTEM! and the OATS is +1.21 dB and the
standard deviation is 1.52 dB.
Frequency
(MHz)
GTEM!
Computed Field
Strength
(dB uV/m)
OATS Measured
Field Data
(dB uV/m)
Difference
(dB)
400.0
93.5
93.7
+0.2
500.0
93.7
92.9
-0.8
600.0
91.1
93.0
+1.9
700.0
89.8
92.2
+2.4
800.0
92.5
92.3
-0.20
900.0
90.3
93.7
+3.4
1000.0
90.3
91.9
+1.6