Interfering substances – Drucker Diagnostics QBC STAR Dry Hematology Analyzer User Manual
Page 43
6000-300-000 5–3
5 – Performance and Limitations
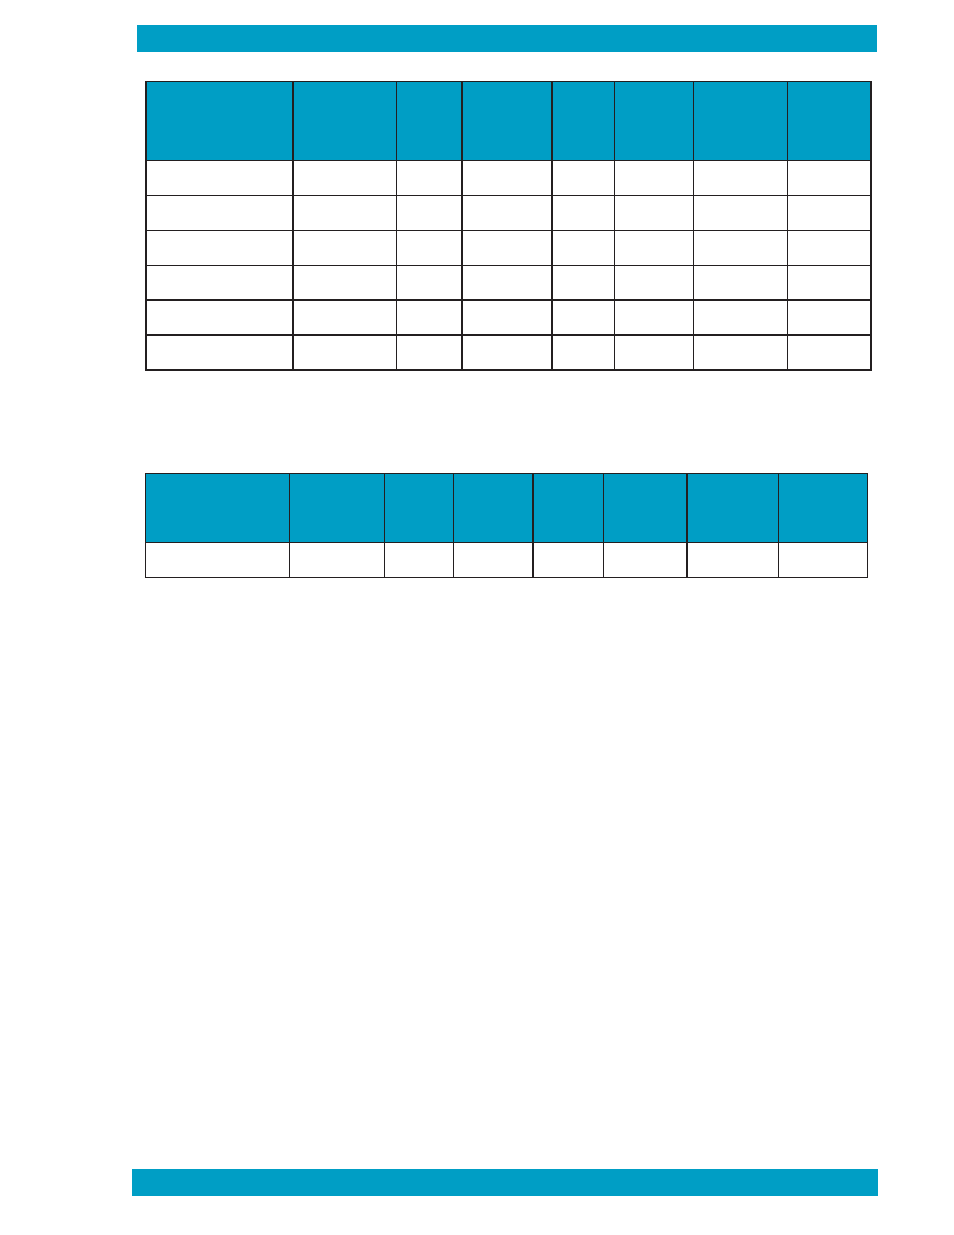
Parameter
Correlation
Coefficient
Slope
Intercept
QBC
Mean
Cell
Counter
Mean
Range of
Values
Number
of
Samples
Hematocrit (%)
0.983
0.973
2.572
36.5
34.8
15.7 – 61.7
646
Hemoglobin (g/dL)
0.984
0.982
0.387
12.1
12.0
5.2 – 18.5
638
Platelet (x 10
9
/L)
0.962
0.935
17.701
244
242
23 – 913
558
WBC (x 10
9
/L)
0.974
1.124
–0.936
10.4
10.1
1.6 – 92.9
535
Granulocyte (x 0
9
/L)
0.972
0.991
0.152
7.0
7.0
0.8 – 45.0
535
Lymph/Mono (x10
9
/L)
0.987
1.206
–0.419
3.3
3.1
0.8 – 89.9
535
the hematocrit results shown above reflect the calibration methods of the Coulter or Sysmex analyz-
ers used in the correlation study. the QBC Star software has been calibrated to match the interna-
tional reference standard for microhematocrit (MHCt) technology. the data shown in the table below
was obtained by comparing the QBC Star results against the microhematocrit reference method.
12
Interfering Substances
• Hemolysis: Do not perform tests on visibly hemolyzed blood specimens.
• Bilirubin: No effects on test results have been observed at bilirubin concentrations up to 20
mg/dL.
8
• Triglycerides: No effects on test results have been observed at triglyceride concentrations up
to 1,800 mg/dL.
8
• Coumadin: Anticoagulant therapy has been shown to have no clinically significant effect on
performance.
8
• Doxorubicin: Treatment with the anthracyclic drug Doxorubicin does not appear to interfere
with the QBC test method.
8
• Other Drugs: The effects of other potentially interfering drugs and their metabolites on QBC
tests have not been established.
9, 10
6000-300-000 5-3
* Products of Coulter Electronics, Hialeah, FL and tOa Medical Electronics, Kyoto, Japan.
Parameter
Correlation
Coefficient
Slope
Intercept
QBC
Mean
Cell
Counter
Mean
Range of
Values
Number of
Samples
Microhematocrit (%)
0.986
1.023
–0.650
36.5
36.3
15.7 – 61.9
646