Operation, Wasted energy – Bully Dog Watchdog User Manual
Page 16
OperATION
31
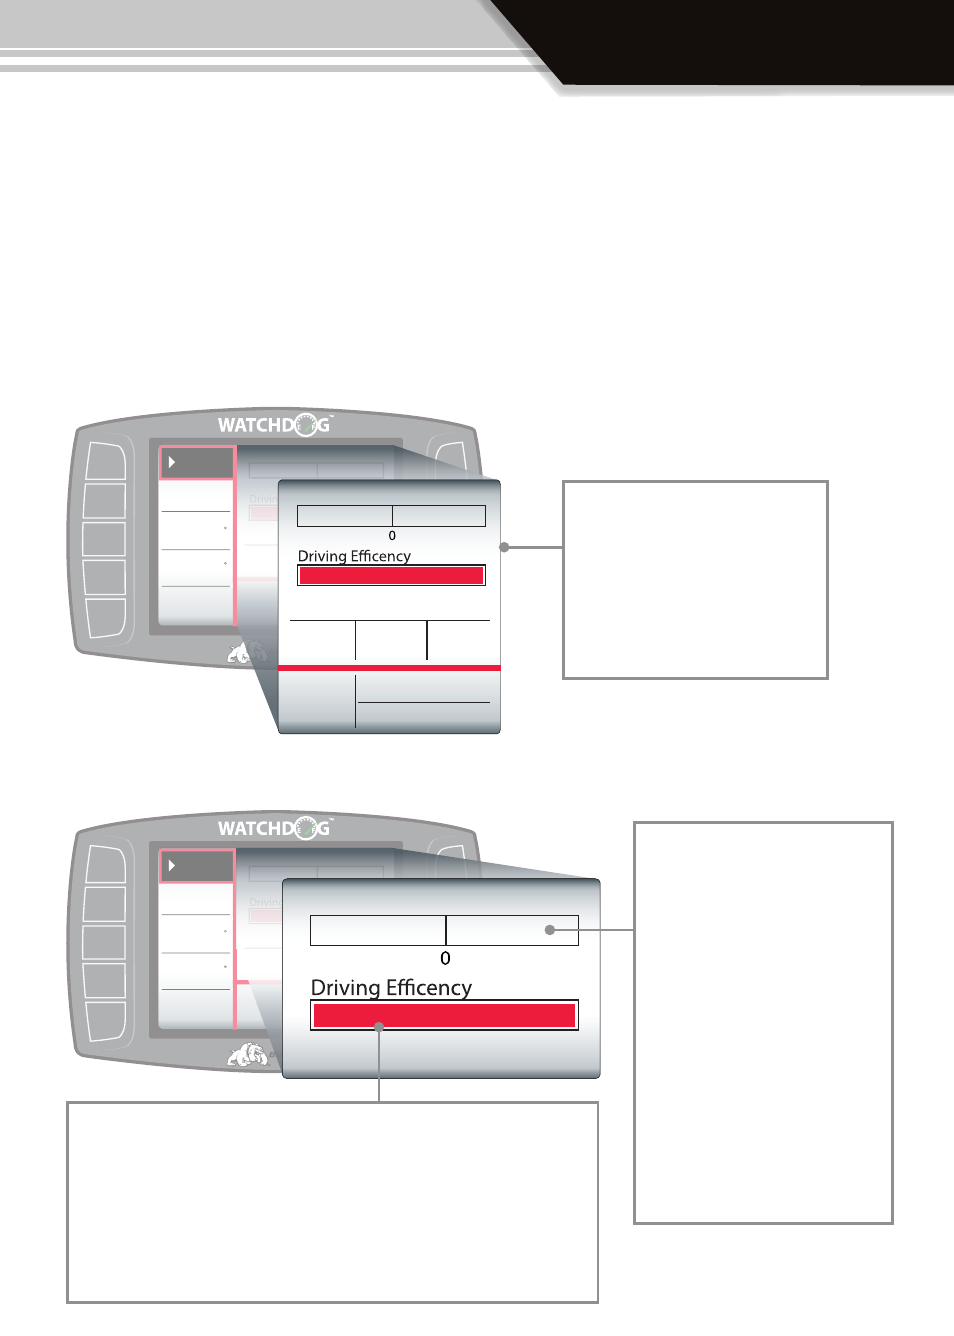
the DriVing COaCh Display DiagraMs:
The Large Gauge Area is where the Driving Coach information is displayed. The diagrams
below, and on the following page, illustrate the information that is collected and displayed
by the Driving Coach. There are four different Driving Coach diagrams below that will break-
down and describe the information displayed in the Driving Coach.
Diagram 1: Driving Coach Location
Diagram 2: Wasted Energy and Driving Efficiency Bars
Menu
Coolant
RPM
Intake
Economy
00
rpm
25
mpg
25
23
25
2138
B-
B
32
F
32
F
Wasted Energy
Dec.
Acc.
Low
Average Mpg
Instant Mpg
Trip Mpg
Trip Grade
Gallons
Grade
High
Wasted Energy
Dec.
Acc.
Low
High
Menu
Coolant
RPM
Intake
Economy
00
rpm
25
mpg
25
23
25
2138
B-
B
32
F
32
F
Wasted Energy
Dec.
Acc.
Low
Average Mpg
Instant Mpg
Trip Mpg
Trip Grade
Gallons
Grade
High
25
23
25
2138
B-
B
Wasted Energy
Dec.
Acc.
Low
Average Mpg
Instant Mpg
Trip Mpg
Trip Grade
Gallons
Grade
High
Driving Efficiency: This bar indicates a level of consistent driving, if a
driver varies between acceleration and deceleration frequently then
this bar will be negatively affected. Additionally heavy acceleration
and deceleration can have a very negative effect. This bar will help
a driver drive at more consistent speeds which will positively affect
their fuel economy.
Wasted Energy: The waste en-
ergy graph, displays accelera-
tion and deceleration. The cen-
ter line of this graph represents
zero wasted energy. If a driver
accelerates too quickly or de-
celerates too quickly they will
see a bar extend outward from
zero indicating an amount of
energy wasted. The sensitivity
of the wasted energy bar can
be adjusted in the “Adjust Ac-
celeration”, menu.
The Driving Coach: The high-
lighted area on the WatchDog
screen represents the Driving
Coach information display. All
of the highlighted information
makes up the Driving Coach.