Zoom in/out, Zoom in, Learn – BLUESHAPE BSMon v3.0 User Manual
Page 27: Zoom out
This button allows measurement of the charge/discharge capacity related to a selected chart area.
how to use it
Export chart
This button allows exporting an image of the actual chart in GIF format (Graphics Interchange
Format).
Export data
This button allows export of all the data logged in CSV format (Comma Separated Value). CSV file
is a special text file format that allows easy data exchange between applications such as
spreadsheets and databases.
Chart selector
These buttons allow switching between the two charts available,
chart and
chart.
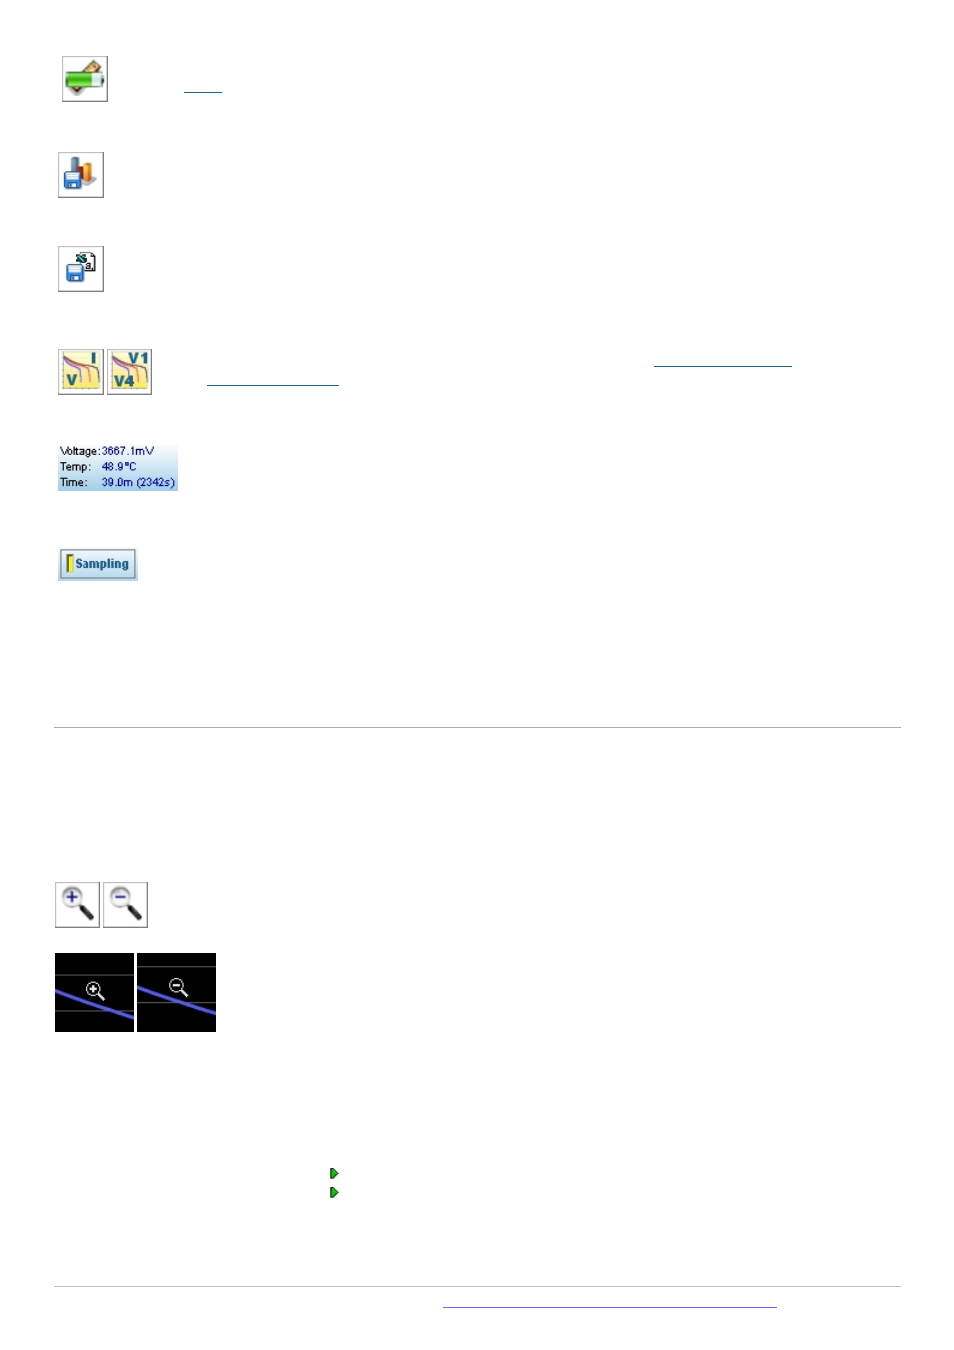
Mouse tracking
When the mouse pointer moves over the chart area, the coordinate indicator box on the top right
will show the actual mouse coordinates. Depending on the chart selected, the data is expressed as
Voltage (mV), Current(mA), Temperature (°C) and Time(minutes and seconds).
Dynamic chart indicator
If the chart shows dynamic data, the sampling indicator will flash every second to indicate the real
time activity. At the same frequency the chart is also refreshed.
In case of the static chart, this indicator will be disabled and hidden.
Zoom In/Out
Through zooming, the user can inspect the chart areas and increase or reduce details.
The Zoom tool is selected from 2 buttons located on the toolbar of the chart viewer form.
When selected, the mouse pointer changes to a magnifier with the "+" or "-" sign indicating the action performed:
Zoom In
the Zoom-In tool can be operated in two ways
1.
by clicking on the chart:
when the tool is selected and the user clicks on the chart:
the chart is re-centered on that point
the chart is magnified by 20%
To further magnify the chart, the operation can be repeated up to the desired level.
Created with the Standard Edition of HelpNDoc: