Single cell voltage, Single cell voltages – BLUESHAPE BSMon v3.0 User Manual
Page 25
are available to get additional information, analyse data and manipulate the chart.
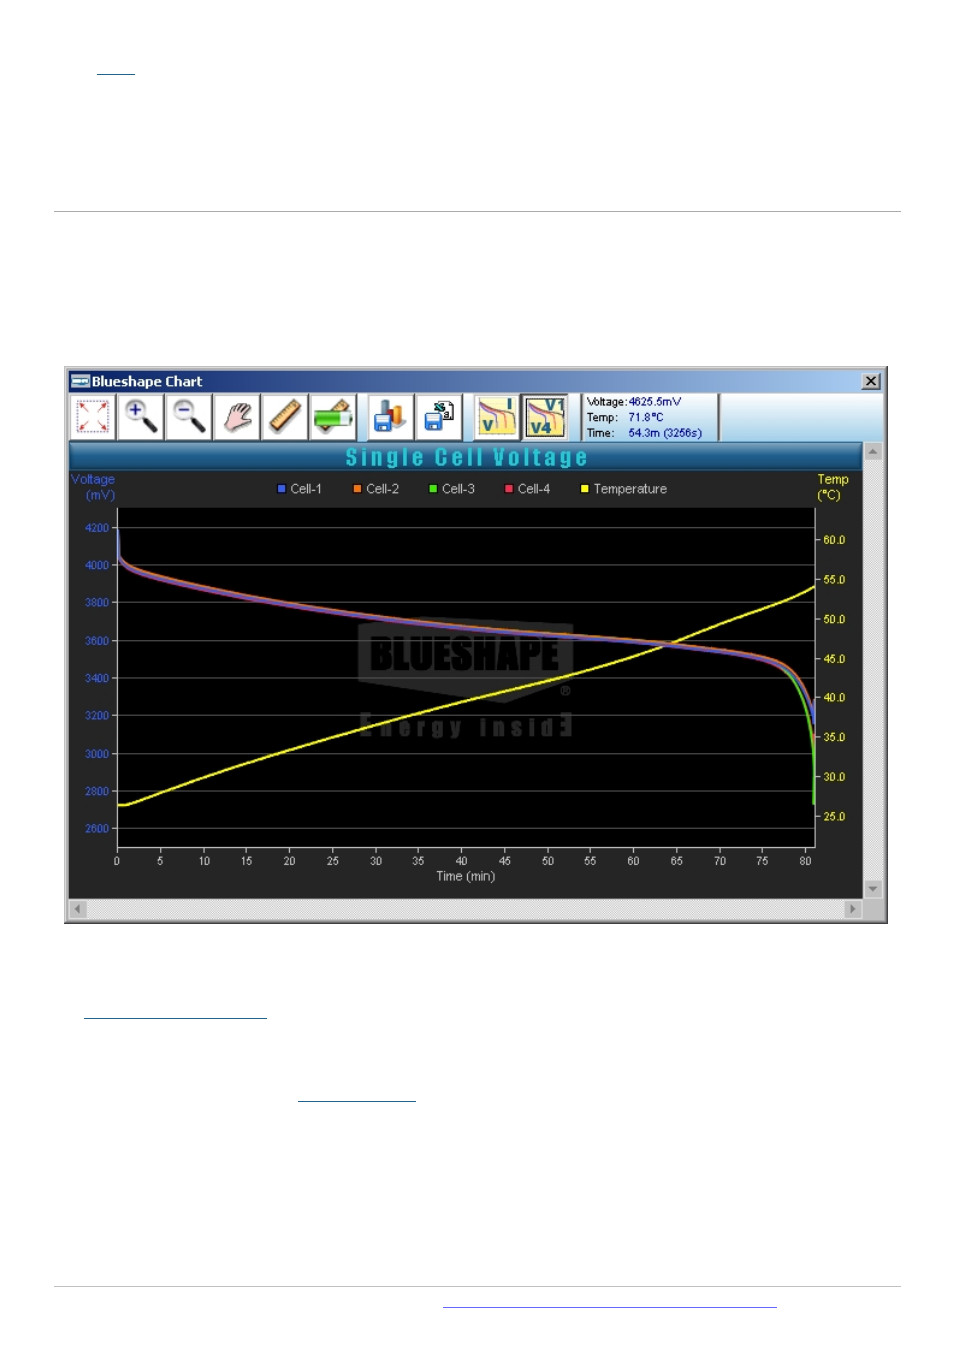
Single Cell Voltage
The Single Cell Voltage chart display the actual voltage of each of the 4 cells that makes the internal stack of batteries,
and the cell temperature on a time scale.
The chart is autoscaled to show all the possible information in one windows, scaling automatically from seconds to
minutes as logged data increases.
The
is displayed on a different data series painted using different color (blue, orange, green,
red) to better distinguish one series from the others. The scale on the left hand side of the chart is set automatically from
2600mV to 4200mV.
The Temperature series shows the
: it is displayed in yellow and uses the scale on the right hand side of
the chart, that is changed automatically depending on the data shown.
Chart hot spot:
Created with the Standard Edition of HelpNDoc: