Measuring insertion loss, Frequency response, Figure 6 representative frequency response – Bird Technologies 4527 User Manual
Page 21
9
Measuring Insertion Loss
1.
Check forward and reverse power equality with a high quality open circuit,
2.
Connect an open-circuited, unknown line to the wattmeter.
3.
Measure the line twice (once down and once back).
Note: The measured
φ is the attenuation for two passes along the line.
4.
Compare the attenuation with published data for line type and length
(remember to halve N
db
or double the line length to account for the mea-
surement technique).
Note: This measurement should be supplemented by either time
domain reflectometry or DC continuity and leakage checks, since the
attenuation measurement alone cannot account for faults such as
open or short circuits partway down the line.
Note: Tery small attenuations require allowance for normal instru-
ment errors. Make sure to note exact readings, or their difference, on
the initial equality check, and correct for this.
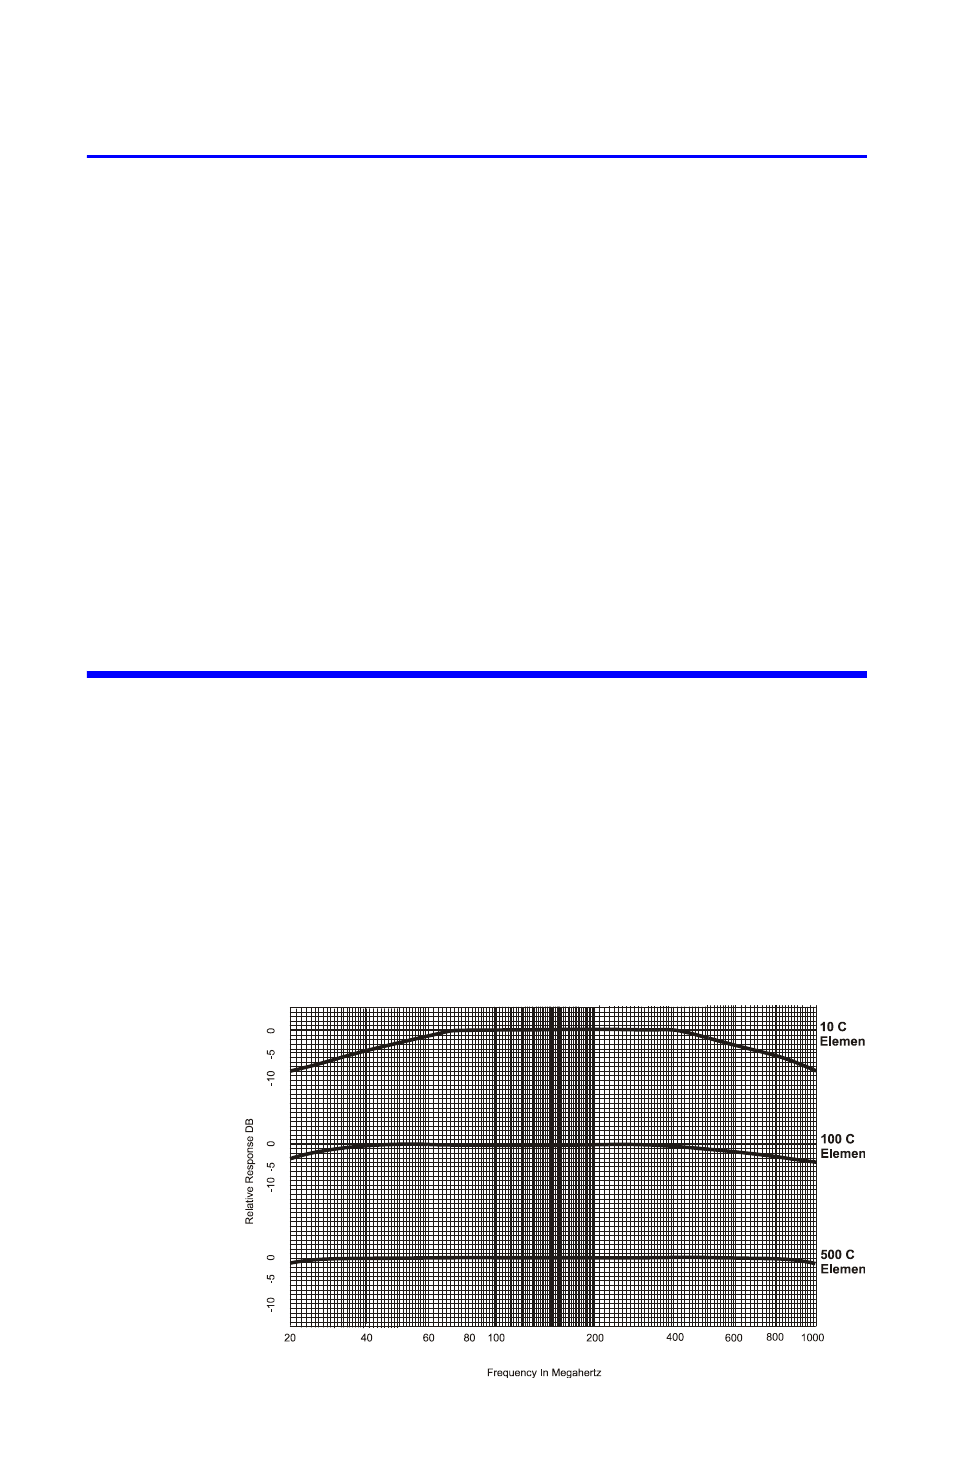
Frequency Response
Bird Plug-In Elements have a flat frequency response over their specified operat-
ing range. A sample set of curves is shown in Figure 6. Notice that for the low
power element, the rolloff outside its frequency band is more pronounced than
for the high power elements.
Example - At 40 MHz the 10C element will have a loss of 4
dB, giving a reading of about 40% of the true value For the
100C, the loss will only be about 1 dB, for a reading at 80%
of the true value, and the 500C should be within the nor-
mal 5% of full scale tolerance.
Figure 6 Representative Frequency Response