MTS 85X Damper User Manual
Page 38
Damper System Operation
38
About Running Tests
793 Controller Operation Overview
•
Mean/amplitude data
•
Maximum/minimum values
Meters can be aligned on the desktop vertically, horizontally, or in a grid. Meter
displays can be sized to your preference.
Scope display
The Scope window in the Station Manager application is an oscilloscope. You
can use it to plot signals against time, frequency, and against each other. You can
create up to four scopes per station, and add up to four signal pairs per scope.
Note
For a description of individual controls and indicators on the Scope, see
the MTS Series 793 Control Software manual (PN 100-147-130).
You can adjust trace time and scaling in the same way you can with an
oscilloscope. You can also select auto-scaling and resetting.
You can use the Program Control feature of the scope to automatically start the
scope when you start the test.
You can also use the scope to plot one channel versus another, and to plot in the
frequency domain rather than the time domain.
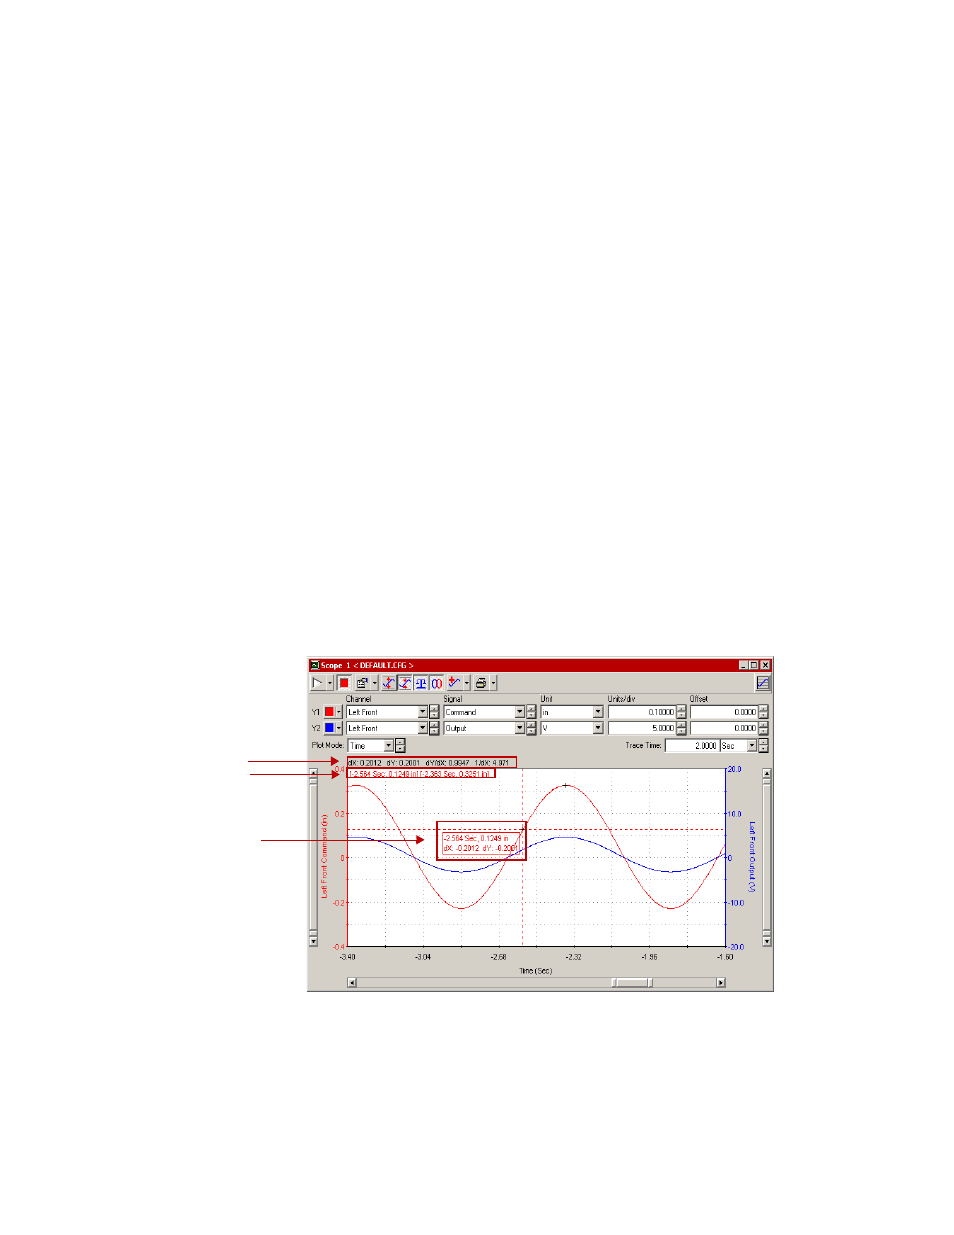
Data point display box
The scope also allows you to pan trace history, and for Series 793 Software
version 4.0 or later, you can also pick and view individual data points.
When you place the cursor on the trace, it becomes a crosshairs. With the
crosshairs, you can select individual data points on the trace and see their precise
coordinates on the axes in the associated display box.
Marker delta display
Marker coordinates
display
New marker with data
point display box