Google Understanding Visualization by Understanding Individual Users User Manual
Page 3
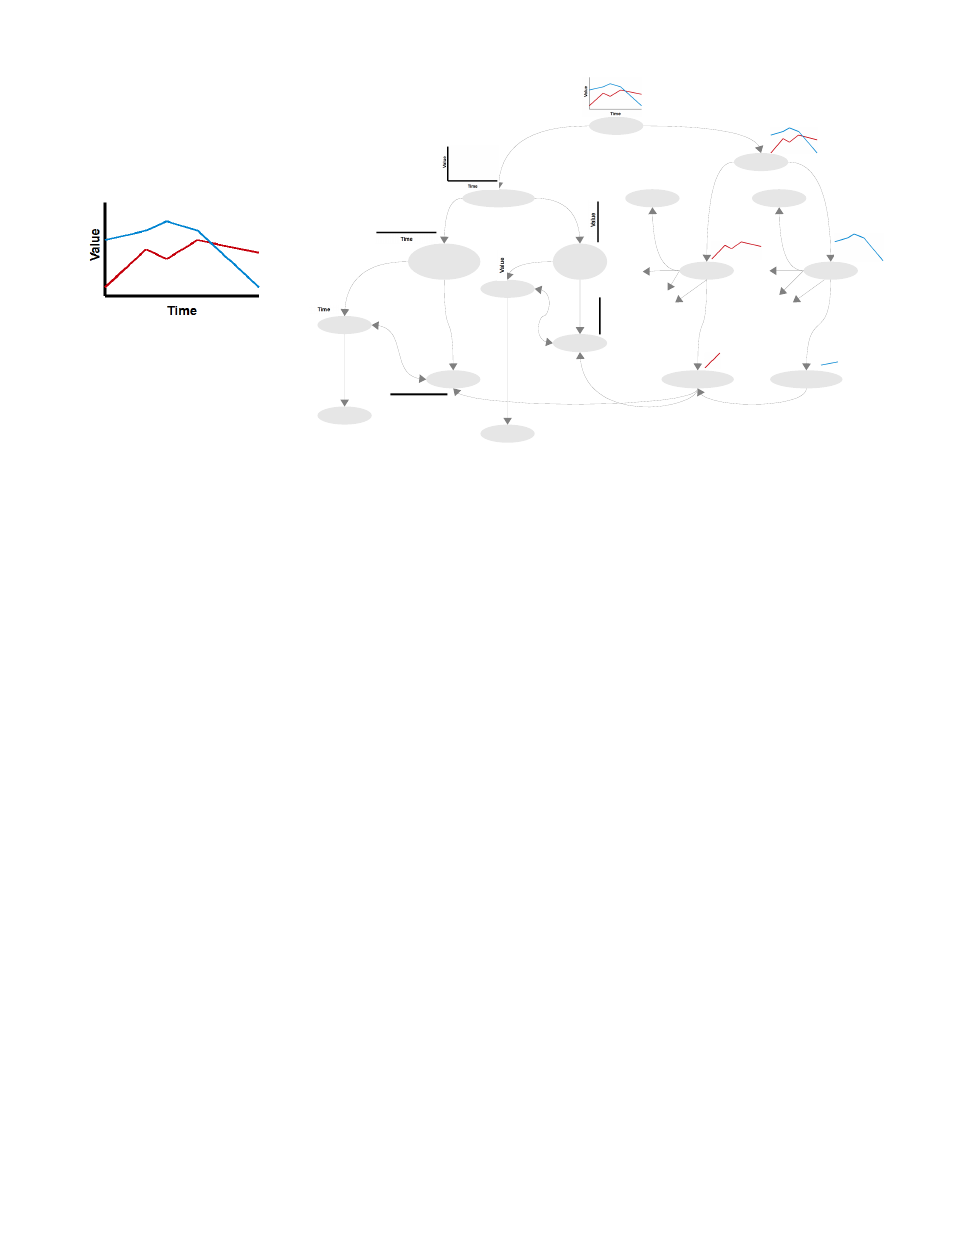
scene
L-shaped
lines
part
part
linear
horizontal
linear
vertical
part
part
text
text
line
line
part
part
part
part
parallel
parallel
“Value”
“Time”
spells
spells
line
line
part
part
segment
segment
part
part
...
...
... ...
...
...
red
blue
color
color
higher-than
coord-
system
coord-system
Fig. 2. A simple line chart, and a decomposition of its parts. Adapted from Steven Pinker’s ”Theory of Graph Comprehension” [10].
(external locus of control). The study compared two complex, dissim-
ilar information retrieval systems, a visual analytics system and a web
interface with a more list-like view. The authors found that users with
a more external locus of control performed better at complex infer-
ential tasks when using the visual analytics interface, and discovered
additional correlations between neuroticism and task performance.
Building on Green et al.’s work, we have conducted studies to iden-
tify visual elements that appear to be stronger classifiers of users [19].
Our goal was to identify the specific design factors that were respon-
sible for the reported results. Our hypothesis was that the underlying
metaphor of the layout was the most significant factor. Therefore, we
studied performance on four simple visualizations (Figure 1) that are
similar in all aspects except for the overall layout style they use. The
purpose of this was to isolate the significant factors in the design of the
visualizations at a finer degree of detail than in previous work, which
mostly studied real-world visualization tools that differed from one
another in many respects.
The four views gradually shift orientation from a list view to one
with a containment metaphor. Participants were first measured for
locus of control and other personality factors, and then performed a
series of search and inferential tasks similar to those used in Green
et al. The results showed that, for inferential tasks, participants with
an internal or external locus of control performed well on different
visualization types, with internal participants showing increased per-
formance as the views became more list-like. In particular, for users
with internal locus of control, using a list-like view can produce up to
14.3% increase in accuracy (from 44.4% to 58.7% correct) and 13.6%
improvement in response time (from 263 to 227 seconds) when com-
pared to using the containment view. External participants showed less
difference in performance overall, but were slightly more adept with
the most container-like view than any others. Like Green et al., we
found this effect in complex tasks but not simple search tasks.
Results of these studies suggest that personality differences may ac-
count for some of the observed individual variability in visualization
use. However, this relationship is not a straightforward one. Perfor-
mance differences based on personality factors appear to manifest for
tasks requiring inference and metaphorical reasoning. It is under these
cognitively demanding situations that visualization is likely to be the
most valuable.
4
R
ELATING
I
NDIVIDUAL
F
ACTORS TO
D
ESIGN
Prior work has demonstrated effects of cognitive ability and personal-
ity differences on visualization use under certain conditions. In order
to generalize from these findings, we must isolate the visualization
factors and evaluate which ones are helpful or harmful to a user with a
given cognitive profile. In turn, we must identify relationships between
two primary sets of factors: the cognitive and personality factors that
describe the user, and the design and structural factors that describe the
visualization. In the case of individual factors, there is a large body of
established research in psychology, but little agreement on which are
most relevant to visualization. In the case of design factors, there is
no real standard language to use when decomposing a visualization.
In both cases, we must identify a set of reliable, measurable factors in
order to identify useful correlations.
Part of this work is narrowing down which personality factors are
most relevant to visualization use. There are already indications of this
from previous work: spatial ability appears to be well-established as
a factor [17], HCI research points to extraversion [11], and Green et
al. [6] have made the discovery that locus of control may be particu-
larly significant for complex visualization use. This work is just the
beginning, however. In order to identify which individual factors are
relevant to visualization, more studies must be performed both to con-
firm the factors already found and to investigate new factors. For ex-
ample, although extraversion was found to be significant in many HCI
studies, it has not shown an effect in any of the visualization studies in
which it has appeared. Is this due to inherent differences between visu-
alizations and other interfaces, differences in the tasks being studied,
or just differences in methodology or study population?
Answering these questions will require both experiments that ex-
amine a broader array of individual factors and experiments that study
known factors in greater depth. In order to focus this research agenda,
a first step may be a formal meta-analysis of the existing findings. This
would demonstrate which factors have the most consistent effects, and
would be a useful way to find connections between the research on in-
dividual differences in visualization and broader HCI research on this
subject. Also important is establishing benchmark tasks and datasets
so that findings from different studies can be more directly compara-
ble. Progress in this area will not only help to focus the set of factors
we study in any given experiment, but also produce information about
which aspects of the individual user are significant for visualization.
A more difficult question is how to uncover information about which