Google Understanding Visualization by Understanding Individual Users User Manual
Page 2
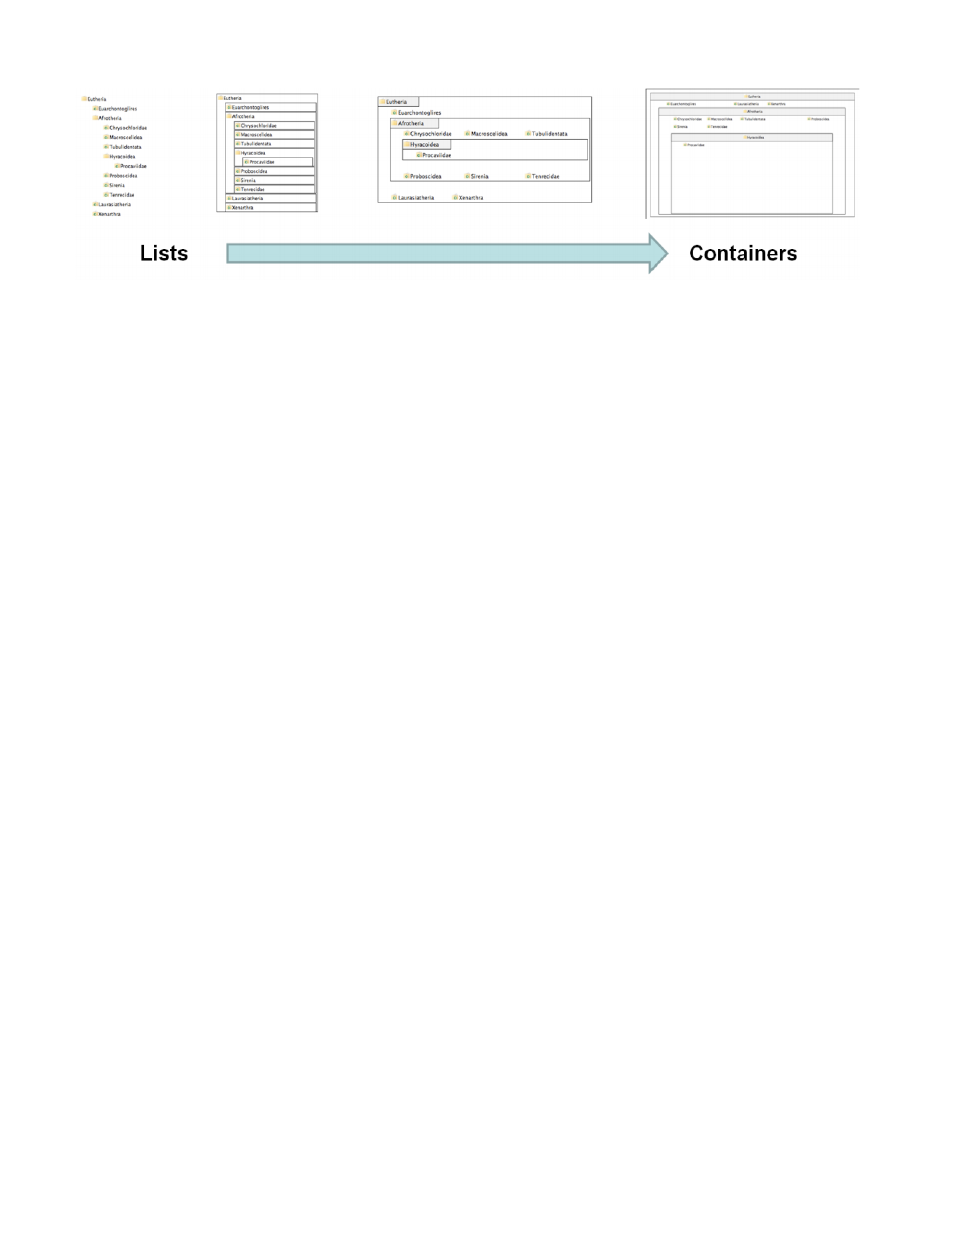
Fig. 1. The four visualizations used in our study on locus of control [19]. These views were designed to vary systematically from a more list-like
metaphor to a container-based metaphor. We found that participants with an internal locus of control performed progressively worse (in both
accuracy and speed in solving complex analytical tasks) as the visual metaphor shifted from lists to containers. Those with an external locus of
control were adept with all views, but especially with the most container-like view.
with low spatial ability rarely discovered the best view from which to
create the cross-section.
Similarly, Chen and Czerwinski [3] found a relationship between
spatial ability and the visual search strategies users employed in a net-
work visualization. Participants viewed an interactive node-link vi-
sualization of a paper citation network and were given tasks to find
papers on specific topics. Spatial ability was positively correlated with
search task performance in general, and also predicted the use of a
better navigation strategy. Low spatial ability participants were more
likely to click through every node in a cluster even after determining
that the cluster was irrelevant to the target topic, while participants
with high spatial ability pursued a more hierarchical strategy in which
they jumped from cluster to cluster until they found a likely neighbor-
hood.
Notably, two of these findings show differences in spatial ability
affecting not just overall performance, but the way users approach a
task. In the cross-section study, high spatial ability participants were
more likely to seek out an optimal view for cross-sectioning, and in
the network visualization study, they employed a more hierarchical
search strategy. The use of different strategies by users with different
cognitive profiles suggests that, when user characteristics vary, there
is no single way for a visualization to best support a given task. If
people with varying cognitive abilities employ different strategies for
the same task, a visualization designed for that task must take this into
account to be effective.
Further research is needed to elaborate on the implications of these
studies. However, they suggest that at least some factors of cognitive
ability affect the strategies people use in a visualization task. What
remains is to fully characterize these strategies and to be able to pre-
dict when differences will arise. While spatial ability is perhaps the
natural first individual difference to study in visualization, it is not the
only one that has an effect. As Yi [18] has recently argued, a better un-
derstanding of individual factors beyond basic spatial ability may be
necessary to understand the variability in visualization evaluation. Yi
suggests several further factors for study, including visual literacy and
personality factors such as field independence and openness to expe-
rience. While more work is needed in this area, several experimental
results already show that differences in user personality can influence
visualization use in significant ways.
3
P
ERSONALITY
F
ACTORS IN
V
ISUALIZATION
Individual differences go beyond basic cognitive abilities to the more
subtle differences that make up a user’s personality. Such differences
may reflect a user’s outlook and common behavior patterns, and re-
cent compelling research on personality differences suggests that they
may have a significant effect on performance. Some of these studies
indicate that these effects are strongest when tasks are complex, pro-
viding a window on how users differ in using a visualization to support
higher-level reasoning.
Personality psychology is a well-established area of research, mak-
ing it a useful lens through which to better understand how different
users approach visualization tasks. A common model in personality
psychology, the Five-Factor Model, categorizes personality traits on
five dimensions: extraversion, neuroticism, openness to experience,
conscientiousness and agreeableness. An individual can be catego-
rized under these personality traits, and longitudinal studies [12] have
shown that these remain consistent throughout adulthood.
There has been some research in human-computer interaction
showing that these personality factors are signficantly correlated with a
user’s preference for visual interface designs. For example, a study by
Saati et al. [14] on interface skinning in a music player compared pref-
erences for five “skins”, or visual themes, that varied only on the dom-
inant color. These results showed that preference for the blue theme
was positively correlated with introversion, the yellow theme was pre-
ferred by more conscientious users, and more imaginative users pre-
ferred the black theme. While user preference may affect adoption
rates for a visualization system, differences in performance are more
valuable in understanding how people use visualization.
That examination of the role of personality on performance remains
relatively sparse in HCI research reflects a commonly-held, if implicit,
assumption that personality is more superficial than cognitive ability,
and therefore unlikely to affect much beyond surface reactions to de-
sign. Nonetheless, such studies, including those summarized in an
early review by Pocius [11] have suggested that personality can affect
interface use at a deeper level. For example, this meta-analysis indi-
cated that introversion is consistently positively correlated with both
programming ability and performance with computer-assisted instruc-
tion tasks.
In visualization specifically, recent work has shown that personality
traits can significantly affect complex task performance. For exam-
ple, Ziemkiewicz and Kosara [20] performed an experiment on how
conflicting metaphors affect tree visualization evaluations. By vary-
ing verbal and visual metaphors in the evaluation conditions, we stud-
ied the extent to which different users slowed down in response to
metaphor conflicts. The results showed that users who scored highly
on the openness to experience dimension of the Five Factor model
were unaffected by conflicting verbal and visual metaphors. This study
also found a similar effect for spatial ability, but the two factors were
independent of one another. While this study did not directly compare
performance on different types of visual design, it does suggest that
participants with high openness and spatial ability may have an eas-
ier time switching between different design metaphors, such as those
found in a multi-view system.
Green et al. [6, 7] studied the use of visual analytics interfaces by
users with varying scores on the Five Factor model and a personality
dimension called locus of control [13]. Locus of control measures the
extent to which a person sees herself as in control of events (internal
locus of control), as opposed to being controlled by outside factors