11 histogram information, 1 bin, 2 magnitude – Cirrus Logic CDB5463U User Manual
Page 22: 3 mean, Figure 14. his, Cdb5463u
CDB5463U
22
DS805DB2
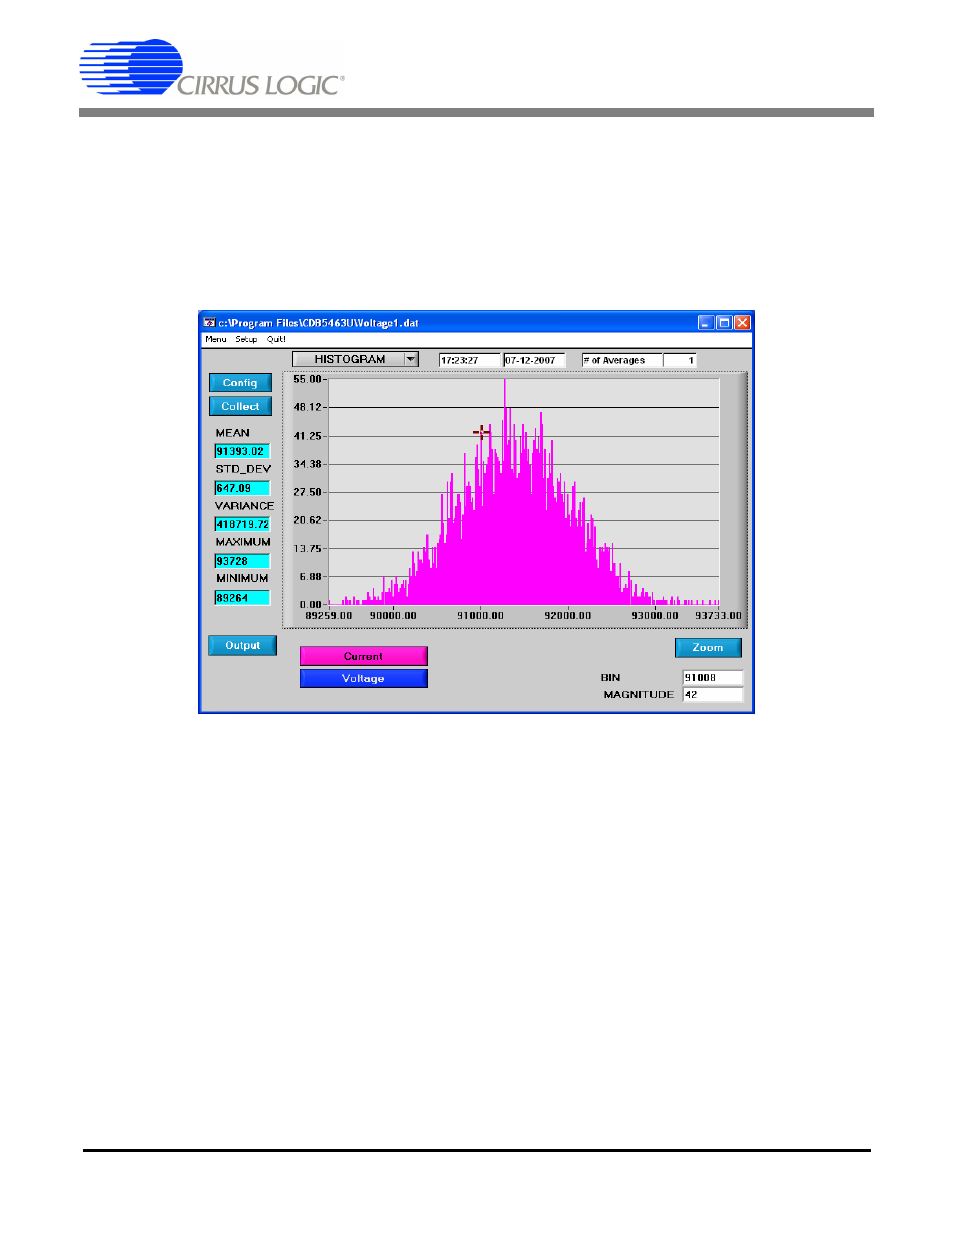
analysis processes acquired conversions to produce a histogram plot. Statistical noise calculations are
also calculated and displayed.
2.8.11 Histogram Information
The following is a description of the indicators associated with histogram analysis. Histograms can be plot-
ted in the Data Collection Window by setting the analysis type pull-down menu to Histogram.
Figure 14. Histogram Analysis
2.8.11.1 BIN
Displays the x-axis value of the cursor on the histogram.
2.8.11.2 MAGNITUDE
Displays the y-axis value of the cursor on the histogram.
2.8.11.3 MEAN
Indicates the mean of the data sample set. The mean is calculated using the following formula:
Mean
Xi
i
0
=
n 1
–
∑
n
----------------
=
See also other documents in the category Cirrus Logic Hardware:
- CobraNet (147 pages)
- CS4961xx (54 pages)
- CS150x (8 pages)
- CS1501 (16 pages)
- CS1601 (2 pages)
- CS1601 (16 pages)
- CS1610 (16 pages)
- CRD1610-8W (24 pages)
- CRD1611-8W (25 pages)
- CDB1610-8W (21 pages)
- CS1610A (18 pages)
- CDB1611-8W (21 pages)
- CDB1610A-8W (21 pages)
- CDB1611A-8W (21 pages)
- CRD1610A-8W (24 pages)
- CRD1611A-8W (25 pages)
- CS1615 (16 pages)
- AN403 (15 pages)
- AN401 (14 pages)
- AN400 (15 pages)
- AN375 (27 pages)
- AN376 (9 pages)
- CRD1615-8W (22 pages)
- CRD1616-8W (23 pages)
- AN402 (14 pages)
- AN404 (15 pages)
- CRD1615A-8W (21 pages)
- CS1615A (16 pages)
- CS1630 (56 pages)
- AN374 (35 pages)
- AN368 (80 pages)
- CRD1630-10W (24 pages)
- CRD1631-10W (25 pages)
- CS1680 (16 pages)
- AN405 (13 pages)
- AN379 (31 pages)
- CRD1680-7W (31 pages)
- AN335 (10 pages)
- AN334 (6 pages)
- AN312 (14 pages)
- AN Integrating CobraNet into Audio Products (16 pages)
- CobraNet Audio Routing Primer (9 pages)
- Bundle Assignments in CobraNet Systems (3 pages)
- CS2300-01 (3 pages)
- CS2000-CP (38 pages)