Register description, 1 chip id - register 01h, 2 mode control 1 - register 02h – Cirrus Logic CS4351 User Manual
Page 24: 1 digital interface format (dif2:0) bits 6-4, Table 7. digital interface formats, 2 de-emphasis control (dem1:0) bits 3-2, Figure 11. de-emphasis curve, Figure 11.de-emphasis curve, Section 6.2.2, Section 6
24
DS566F1
CS4351
6. REGISTER DESCRIPTION
** All register access is R/W unless specified otherwise**
6.1
Chip ID - Register 01h
Function:
This register is Read-Only. Bits 7 through 3 are the part number ID which is 11111b and the remaining Bits
(2 through 0) are for the chip revision (Rev. A = 000, Rev. B = 001, ...)
6.2
Mode Control 1 - Register 02h
6.2.1
Digital Interface Format (DIF2:0) Bits 6-4
Function:
These bits select the interface format for the serial audio input.
The required relationship between the Left/Right clock, serial clock and serial data is defined by the Digital
Interface Format and the options are detailed in
6.2.2
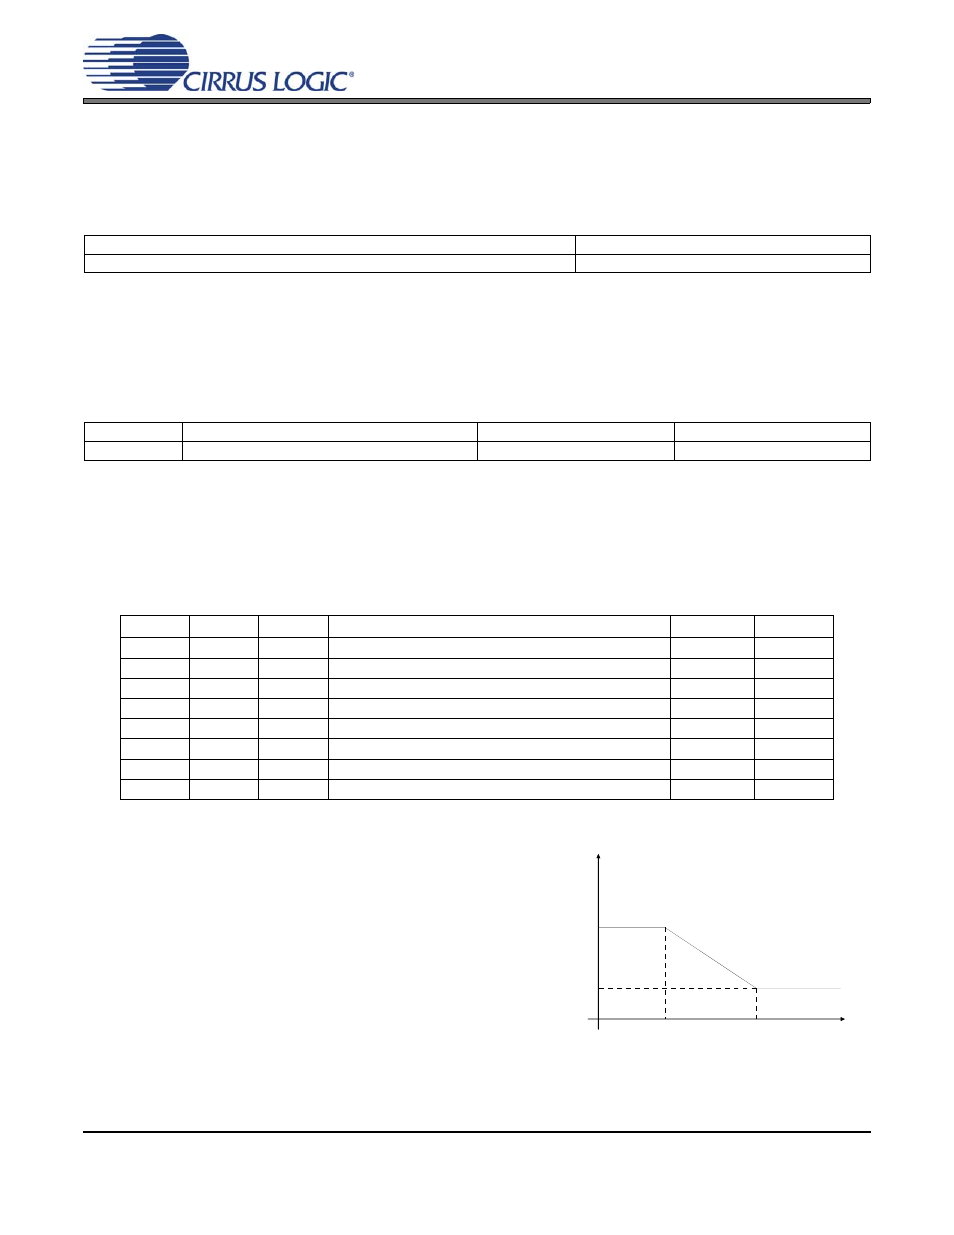
De-Emphasis Control (DEM1:0) Bits 3-2
.
Default = 0
00 - No De-emphasis
01 - 44.1 kHz De-emphasis
10 - 48 kHz De-emphasis
11 - 32 kHz De-emphasis
Function:
Selects the appropriate digital filter to maintain the stan-
dard 15
µs/50 µs digital de-emphasis filter response at
32, 44.1 or 48 kHz sample rates. (See
Note:
De-emphasis is only available in Single-Speed Mode
7
6
5
4
3
2
1
0
PART4
PART3
PART2
PART1
PART0
REV2
REV1
REV0
1
1
1
1
1
-
-
-
7
6
5
4
3
2
1
0
Reserved
DIF2
DIF1
DIF0
DEM1
DEM0
FM1
FM0
0
0
0
0
0
0
0
0
DIF2
DIF1
DIF0
DESCRIPTION
Format
FIGURE
0
0
0
Left Justified, up to 24-bit data
0
(Default)
0
0
1
I
2
S, up to 24-bit data
1
0
1
0
Right Justified, 16-bit data
2
0
1
1
Right Justified, 24-bit data
3
1
0
0
Right Justified, 20-bit data
4
1
0
1
Right Justified, 18-bit data
5
1
1
0
Reserved
1
1
1
Reserved
Table 7. Digital Interface Formats
Figure 11. De-Emphasis Curve
Gain
dB
-10dB
0dB
Frequency
T2 = 15 µs
T1=50 µs
F1
F2
3.183 kHz
10.61 kHz