Myron L PS6 User Manual
Page 39
35
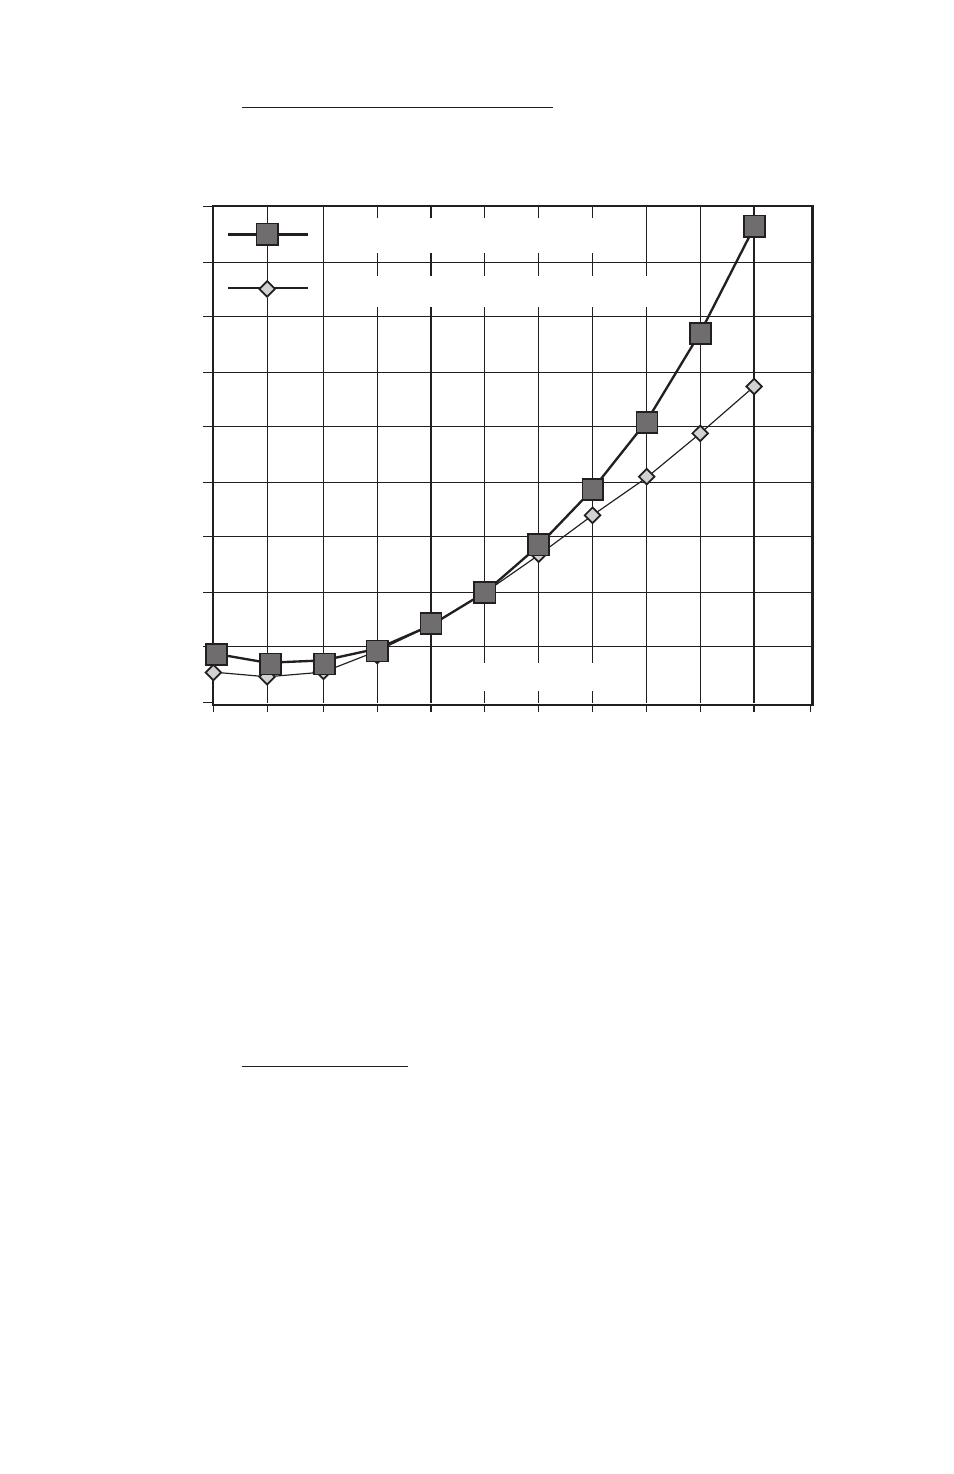
D. A Chart of Comparative Error
In the range of 1000 µS, the error using KCl on a solution that should be
compensated as NaCl or as 442, is illustrated in the graph below.
Users wanting to measure natural water based solutions to 1% would
have to alter the internal compensation to the more suitable preloaded
“442” values or stay close to 25°C. Users who have standardized
to KCl- based compensation may want to stick with it, regardless of
increasing error as you get further from 25°C. The P
ool
P
ro
will provide
the repeatability and convertibility of data necessary for relative values
for process control.
E. Other Solutions
A salt solution like sea water acts like NaCl. An internal correction for NaCl
can be selected for greatest accuracy with such solutions. Many solutions
are not at all similar to KCl, NaCl or 442, however, are still referenced to
one of these for the purpose of commonality.
Clearly, the solution characteristics should be chosen to truly represent
the actual water under test for rated accuracy of ±1%. Many industrial
applications have always been relative measurements seeking a number
to indicate a certain setpoint or minimum concentration or trend. The
P
ool
P
ro
gives the user the capacity to take data in the “KCl conductivity
7%
Chart 2
55
(1)%
(2)%
0%
1%
2%
3%
4%
5%
6%
0 5 10 15 20 25 30 35 40 45 50
Temperature
NaCl error with KCl tempco
442 error with KCl tempco