0 bad navigation example - sidescan, 1 overview, 2 show beamlines – Triton Navigation User Manual
Page 15
Page 12
4.0 Bad Navigation Example - Sidescan
4.1 Overview
The following example illustrates the need for multiple passes of filtering for sidescan
data file. This is an uncommon problem but works well for showing why it is sometimes
necessary for repeat processing of the navigation. This data comes from a Klein 5000
sonar which for this survey had a ping rate set faster than the incoming navigation data.
It is common for GPS receivers to only receive an update every 1 second while sonar ping
rates are much faster. During acquisition as each new ping is received it is assigned the
last known navigation position resulting in multiple pings with the same time and position.
It is possible to get what we call “high speed” GPS data from more expensive equipment
which provides a time and position for each ping.
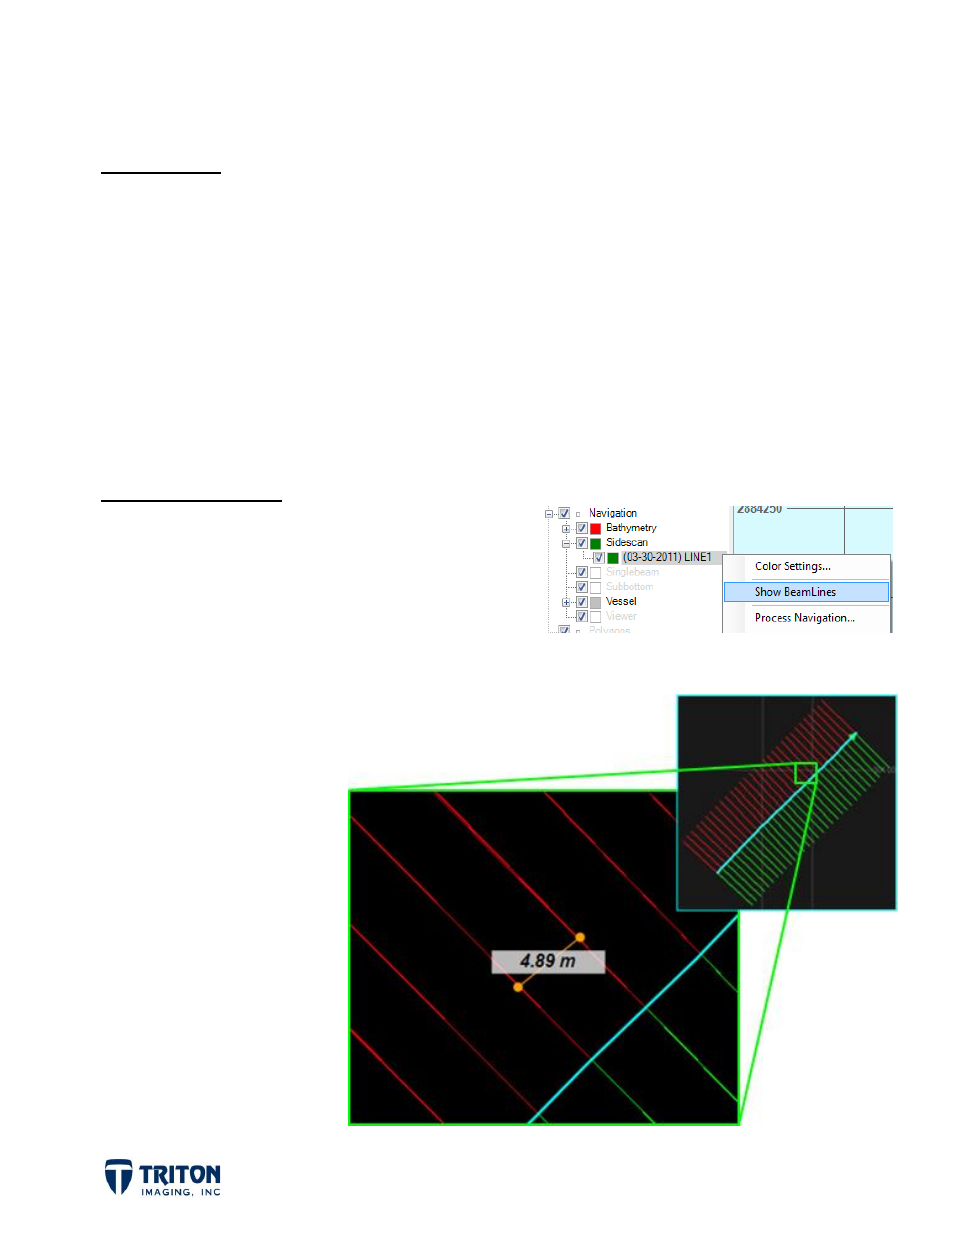
4.2 Show Beamlines
Using
Show Beamlines
, it is possible to see the
beam lines for each ping by right-clicking on the
file name in the sidescan mosaic layer in the file
tree as shown in the image to the right.
For this example you can
see in the images below
the beam lines for this
Klein 5000 survey.
Note the beam line
spacing is up to 4.89
meters apart! This is the
distance the sonar
travelled between
navigation updates so all
the beams that should fall
in this gap are overlapped
at each ping that receives
the new navigation fix
from the GPS receiver.