HP OneView for VMware vCenter User Manual
Page 18
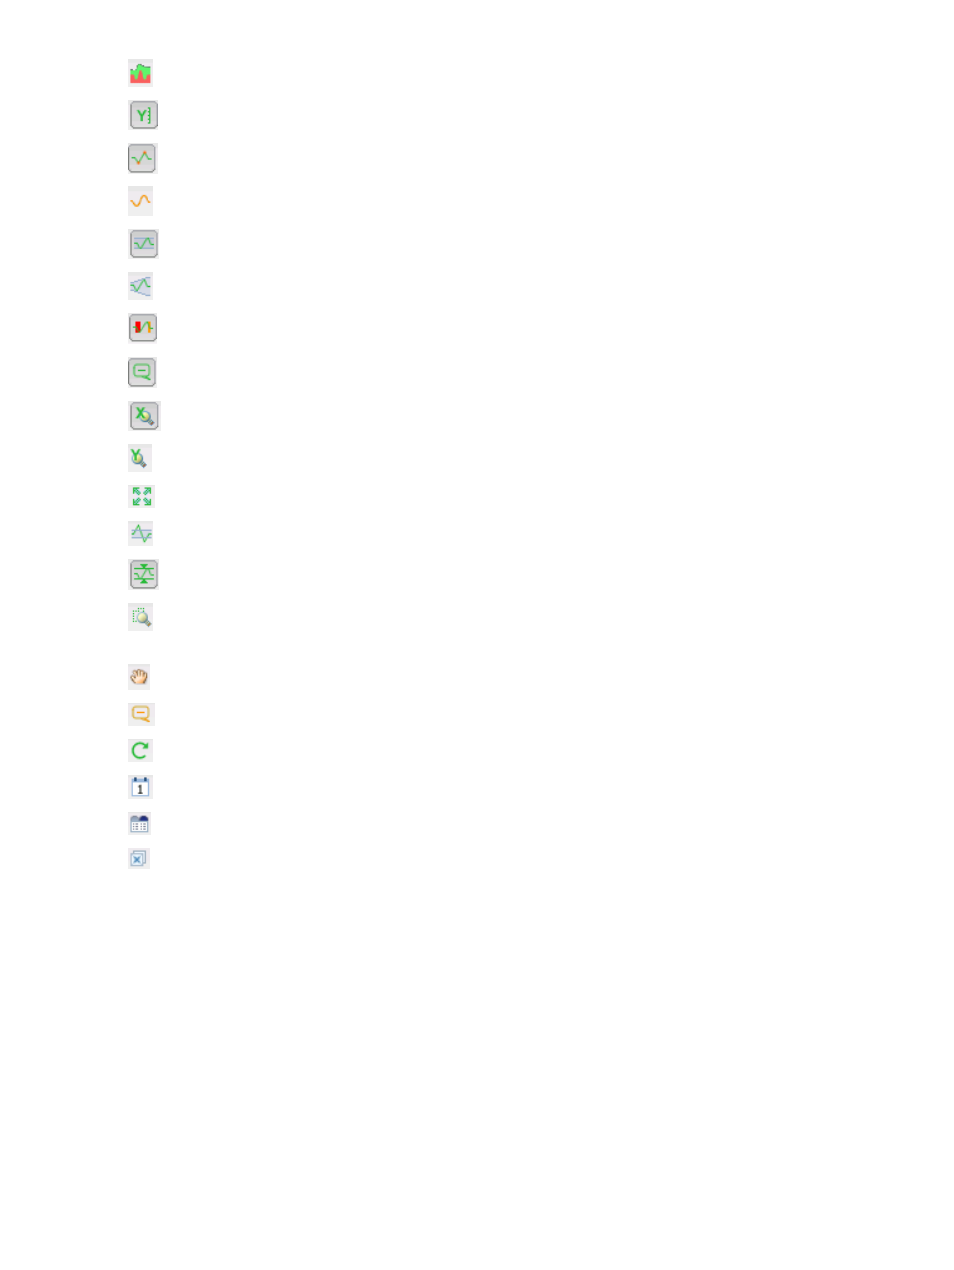
- Stacked graph.
- Y axis.
- Metric graph.
- Trend line.
- Dynamic thresholds.
- Show dynamic period entire thresholds.
- Anomalies.
- Show data point tips.
- Zoom by x.
- Zoom by y.
- Zoom to fit.
- Zoom to dynamic thresholds.
- Compress graphs.
- Zoom all graphs. Y axis values will not turn to scientific form to maintain the same axis width
across all graphs.
- Pan.
- Show data values.
- Auto refresh.
- Date controls.
- Generate dashboard.
- Remove all.
18
Dashboards
See also other documents in the category HP Software:
- Scripting Toolkit for Linux (68 pages)
- Scripting Toolkit for Windows 9.50 (62 pages)
- Scripting Toolkit for Windows 9.60 (62 pages)
- Storage Area Manager (13 pages)
- Core HP-UX (5 pages)
- Matrix Operating Environment Software (232 pages)
- Matrix Operating Environment Software (70 pages)
- Matrix Operating Environment Software (120 pages)
- Matrix Operating Environment Software (36 pages)
- Matrix Operating Environment Software (192 pages)
- Matrix Operating Environment Software (99 pages)
- Matrix Operating Environment Software (198 pages)
- Matrix Operating Environment Software (66 pages)
- Matrix Operating Environment Software (95 pages)
- Matrix Operating Environment Software (152 pages)
- Matrix Operating Environment Software (264 pages)
- Matrix Operating Environment Software (137 pages)
- Matrix Operating Environment Software (138 pages)
- Matrix Operating Environment Software (97 pages)
- Matrix Operating Environment Software (33 pages)
- Matrix Operating Environment Software (142 pages)
- Matrix Operating Environment Software (189 pages)
- Matrix Operating Environment Software (58 pages)
- Matrix Operating Environment Software (68 pages)
- Matrix Operating Environment Software (79 pages)
- Matrix Operating Environment Software (223 pages)
- Matrix Operating Environment Software (136 pages)
- Matrix Operating Environment Software (34 pages)
- Matrix Operating Environment Software (63 pages)
- Matrix Operating Environment Software (67 pages)
- Matrix Operating Environment Software (128 pages)
- Matrix Operating Environment Software (104 pages)
- Matrix Operating Environment Software (75 pages)
- Matrix Operating Environment Software (245 pages)
- Matrix Operating Environment Software (209 pages)
- Matrix Operating Environment Software (71 pages)
- Matrix Operating Environment Software (239 pages)
- Matrix Operating Environment Software (107 pages)
- Matrix Operating Environment Software (77 pages)
- Insight Management-Software (148 pages)
- Matrix Operating Environment Software (80 pages)
- Insight Management-Software (128 pages)
- Matrix Operating Environment Software (132 pages)
- Matrix Operating Environment Software (74 pages)
- Matrix Operating Environment Software (76 pages)