Figure 3-3: current consumption vs. cycle counts, D figure 3-2, Figure 3-3 – PNI RM3000-F Evaluation Board User Manual
Page 7
PNI Sensor Corporation
Doc #1016391 r04
RM3000-f Evaluation Board User Manual
Page 6
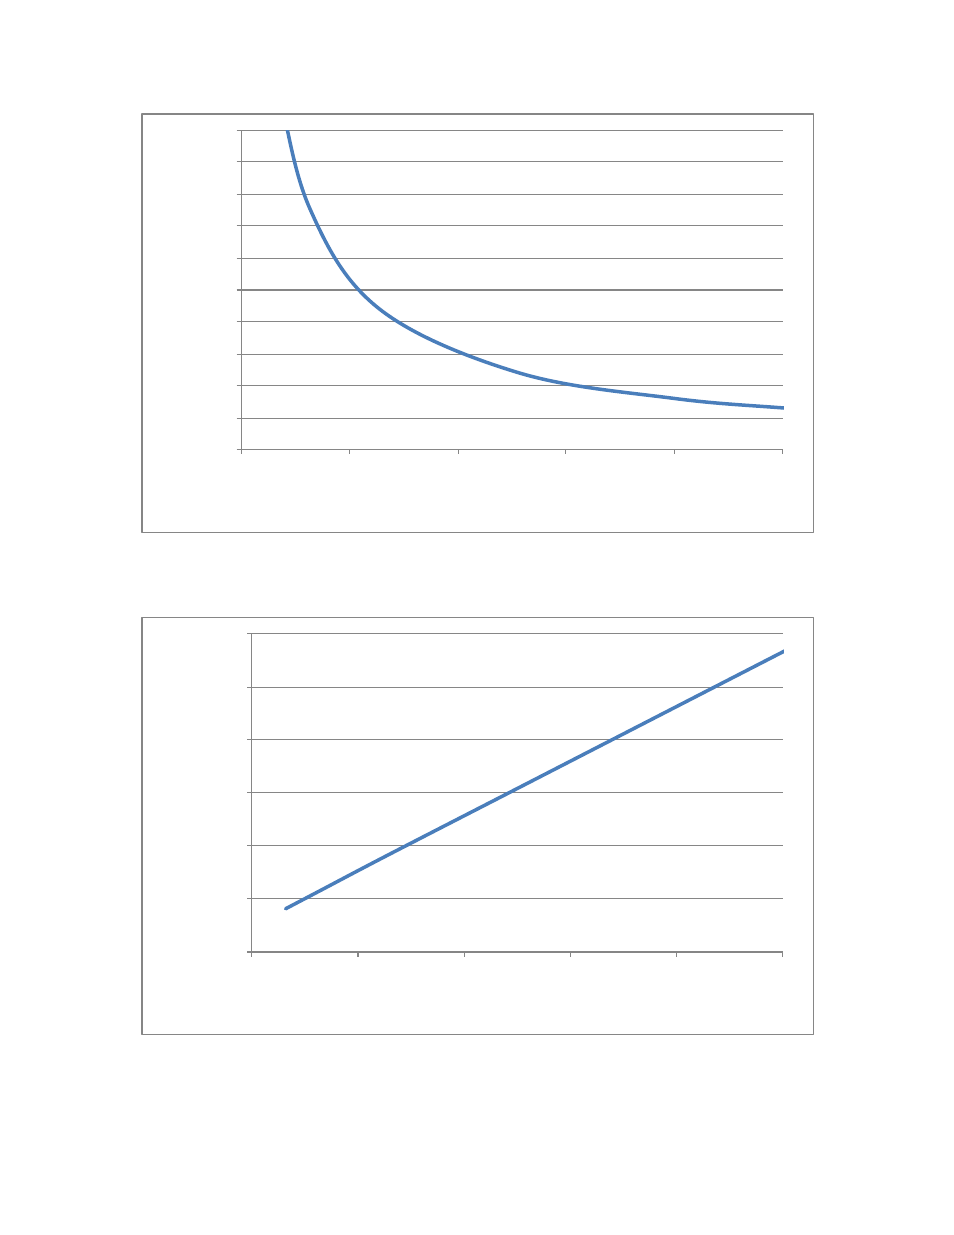
Figure 3-2: 3-Axis Maximum Sample Rate vs. Cycle Counts
Figure 3-3: Current Consumption vs. Cycle Counts
0
100
200
300
400
500
600
700
800
900
1000
0
50
100
150
200
250
3
-A
x
is
M
a
x
im
u
m
D
a
ta
R
a
te
(H
z
)
Cycle Counts
0
50
100
150
200
250
300
0
50
100
150
200
250
3
-A
x
is
C
u
rr
e
n
t
C
o
n
s
u
m
p
ti
o
n
@
1
2
H
z
Sa
m
p
le
R
a
te
(µ
A
)
Cycle Counts