2 typical operating performance, Typical operating performance, Figure 3-1: gain & sensitivity vs. cycle counts – PNI RM3000-F Evaluation Board User Manual
Page 6
PNI Sensor Corporation
Doc #1016391 r04
RM3000-f Evaluation Board User Manual
Page 5
3) Sensitivity
is the inverse of gain, and a single “cycle count” is equivalent to the least significant bit
or “LSB”. System noise limits useable sensitivity such that above ~200 cycle counts there are
diminishing returns on useable sensitivity.
4) The maximum sample rate and the gain are inversely related, such that higher sample rates can
be obtained by reducing the number of cycle counts, but this also results in diminished gain and
sensitivity. Also see Figure 3-1 and Figure 3-2.
5) Operating at greater cycle counts will increase power consumption but generally not provide any
benefit in useable sensitivity due to system noise. 35 Hz single-axis output rate represents ~12
Hz output rate for all 3 axes for the RM3000-f Evaluation Board. Also see Figure 3-3.
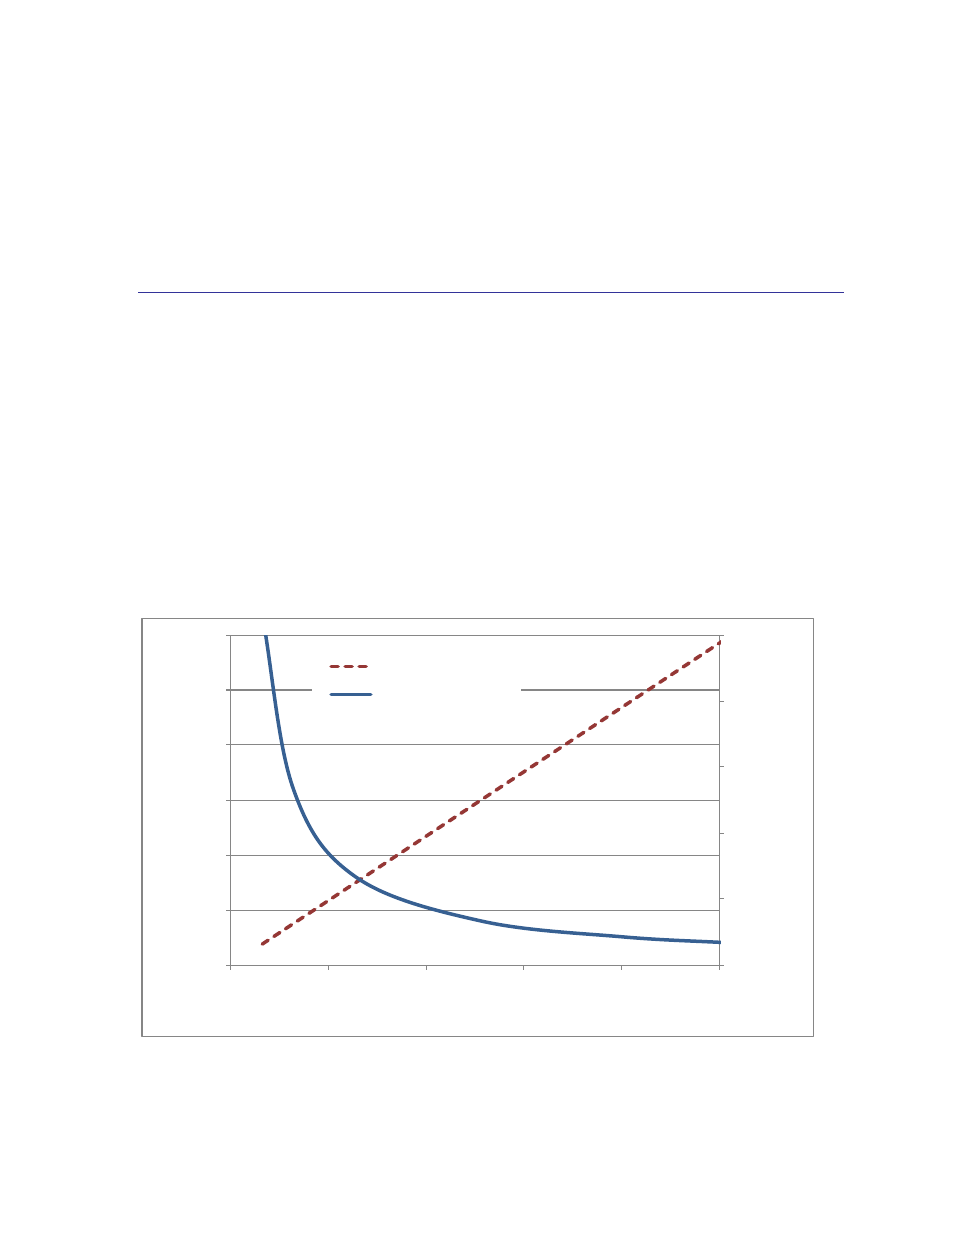
3.2 Typical Operating Performance
The plots below are representative of performance as a function of the number of cycle
counts. The number of cycle counts is determined by the user, as explained in Section 5.1.
The maximum number of cycle counts is 65.5k. But there’s rarely a reason to operate
beyond 250 cycle counts, as explained in the following paragraph, and for this reason the
plots only go to 250 cycle counts.
System noise limits the useable sensitivity of the RM3000-f Evaluation Board above ~200
cycle counts. Above 200 cycle counts there are diminishing returns on useable sensitivity, as
greater cycle counts result in more time and power consumed per measurement with little
improvement in useable sensitivity. For this reason, the plots only go to 250 cycle counts.
Figure 3-1: Gain & Sensitivity vs. Cycle Counts
0
50
100
150
200
250
0
10
20
30
40
50
60
0
50
100
150
200
250
Se
n
s
iti
v
ity
(n
T
)
G
a
in
(c
o
u
n
ts
/µ
T
)
Cycle Counts
Gain (counts/µT)
Sensitivity (nT)