Dataviewer: view and save recorded data, Graphing screen features – Crystal nVision Lab Reference User Manual
Page 11
DataViewer: View and Save Recorded Data
9
CrystalControl Operation Manual
—
DATAVIEWER: VIEW AND SAVE RECORDED DATA
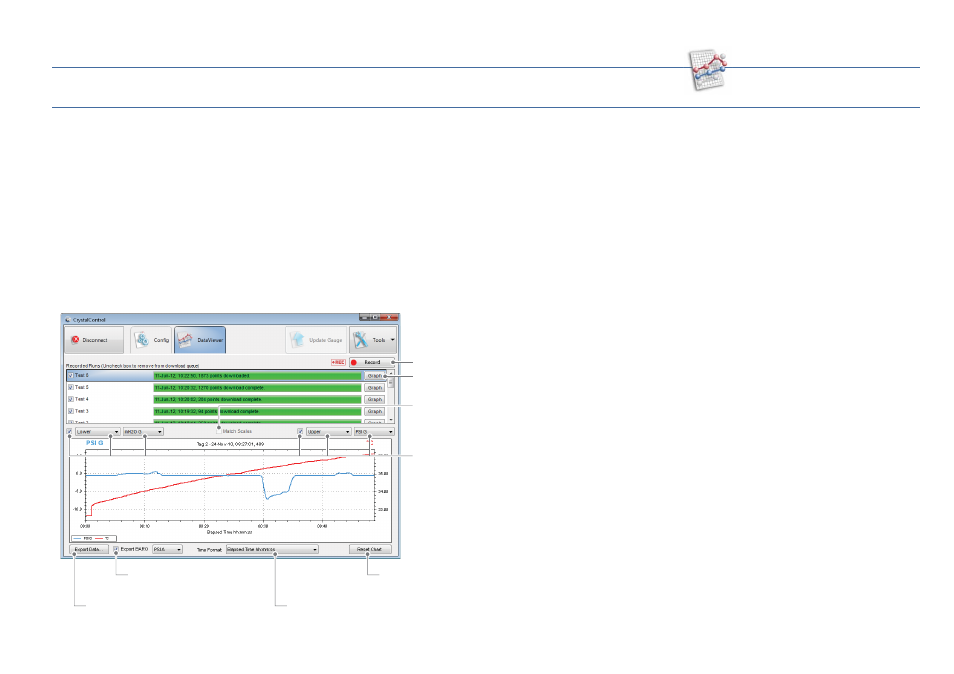
DataViewer allows you to quickly view live or recorded data runs on your PC. Quickly zoom, change units, or export to .xls/.csv/.pdf fi le format in this mode.
Graphing Screen Features
Click on the
Graph button
to display recorded data in the graphing screen. Bypass downloading stored data runs by un-checking the corresponding run box.
•
Record:
Start a recording on the connected nVision.
•
Show Point Values:
Determine specifi c reading and time data by hovering the cursor over appropriate data point.
•
Zoom:
It is possible to zoom in on data by dragging with the left mouse button. Drag to the appropriate size and release.
•
Match Scales:
Match the vertical scales on the graph for easier comparison of data.
•
Reset Chart:
Reset to original graph view.
•
Right Click:
Copy, Save Image As, Page Setup, Print, Show Point Values, Reset Chart.
•
Export Data:
To download and save data from the nVision, simply click the
Export Data button.
See Data Management for further detail.
•
Time Format:
Change elapsed or date/time formats.
Add BARO data to your export
Reset graphing to default zoom view
Select data run for graphing
Record button
Match vertical scales
Select module datatype, unit, and visibility
Export and save in .xls/.csv/.pdf/signed .pdf format
Display and export graph with diff erent time formats
Interact with recorded data in the DataViewer screen.
.