3 how to display fluctuation graph – KANOMAX 6162 Anemomaster User Manual
Page 16
2. Basic Operation
10
TIME (20S/DIV)
25
0
hold
VEL. SLOW2
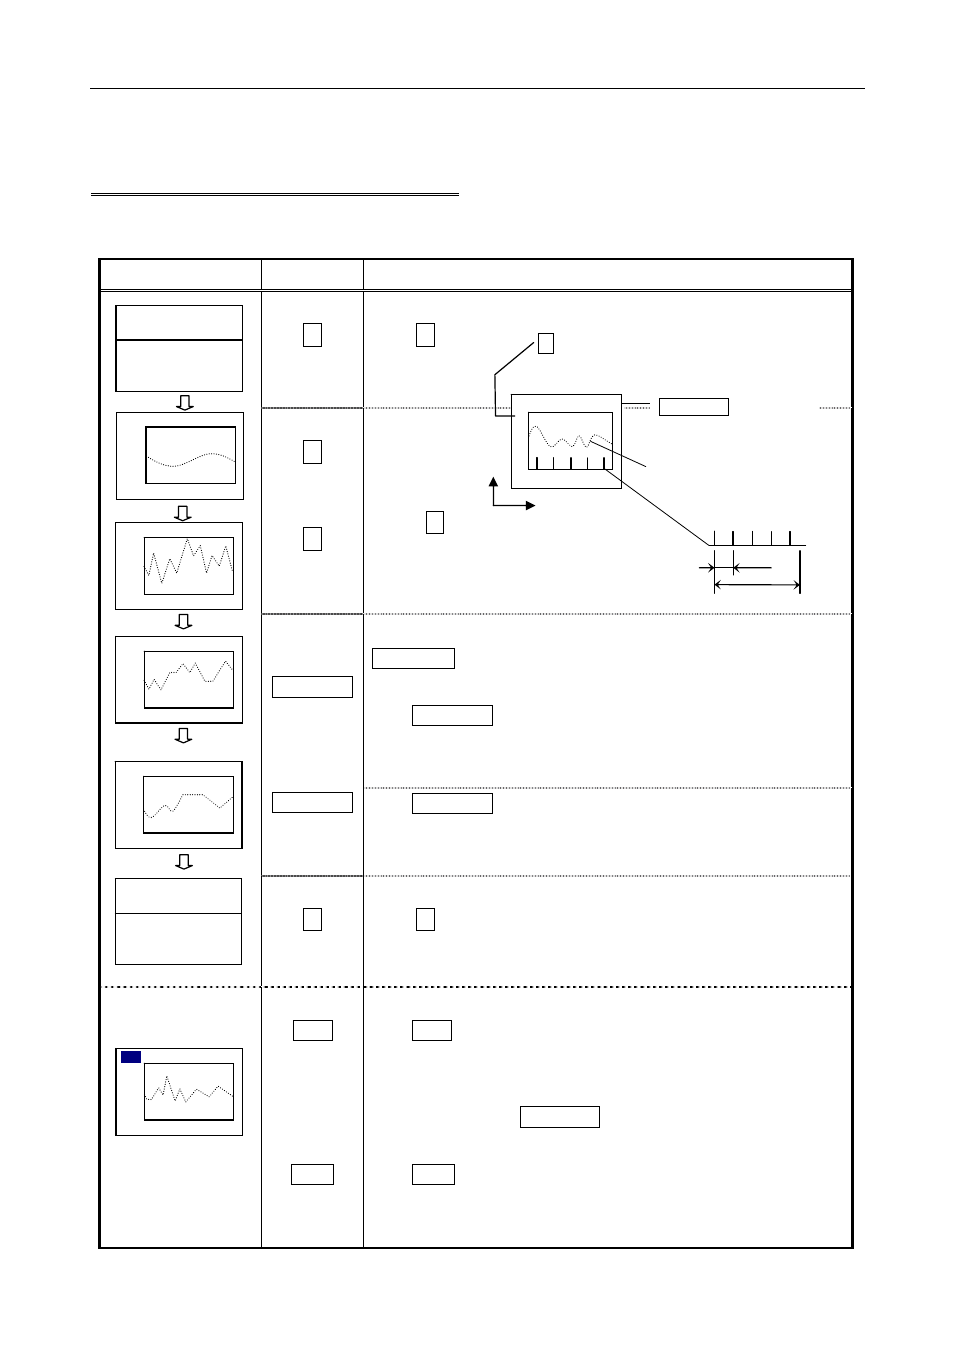
2.3 How to Display Fluctuation Graph
You can monitor velocity fluctuation for 90 seconds.
(* This function cannot be used in the calculation mode.)
Display
Key Procedure
▽
Press ▽ key.
▽
▽
FAST/SLOW key is useful when …
>>> reading varies significantly and it is hard to see the graph.
Press FAST/SLOW key.
····· SLOW 1 (moving average deviations for 5 sec.)
FAST/SLOW
FAST/SLOW Press FAST/SLOW key
····· SLOW 2 (moving average deviations for 10 sec.)
△
Press △ key to go back to the original screen.
HOLD
Press HOLD key
★
Display screen will be on hold.
Even while the reading is on hold, you can still change the
range and switch FAST/SLOW.
Press PRINT key
★
When the reading is on hold, the display can be printed out.
08.07.01 FAST
10:26:40
5.38 m/s
25.7 ℃
TIME (20S/DIV)
m/s VEL. FAST
50
0
TIME (20S/DIV)
m/s VEL. FAST
25
0
TIME (20S/DIV)
m/s VEL. SLOW1
25
0
TIME (20S/DIV)
m/s VEL. SLOW2
25
0
08.07.01 SLOW2
10:26:40
5.38 m/s
25.7 ℃
Air velocity value
updated every 1 sec
one screen: 90 sec
air
velocit
y
measuring time
(sec)
m/s VEL. FAST
TIME (20S/DIV)
50
0
▽
key
Range: 50, 25, 10, 5, 2, 1 m/s
FAST, SLOW1, SLOW2
"
P9
FAST/SLOW key
20 sec
90 sec
time axis
Press ▽ key again.
★
Air velocity range changes.