DeFelsko PosiTector 200 v.3.0 Quick Guide User Manual
Page 9
8
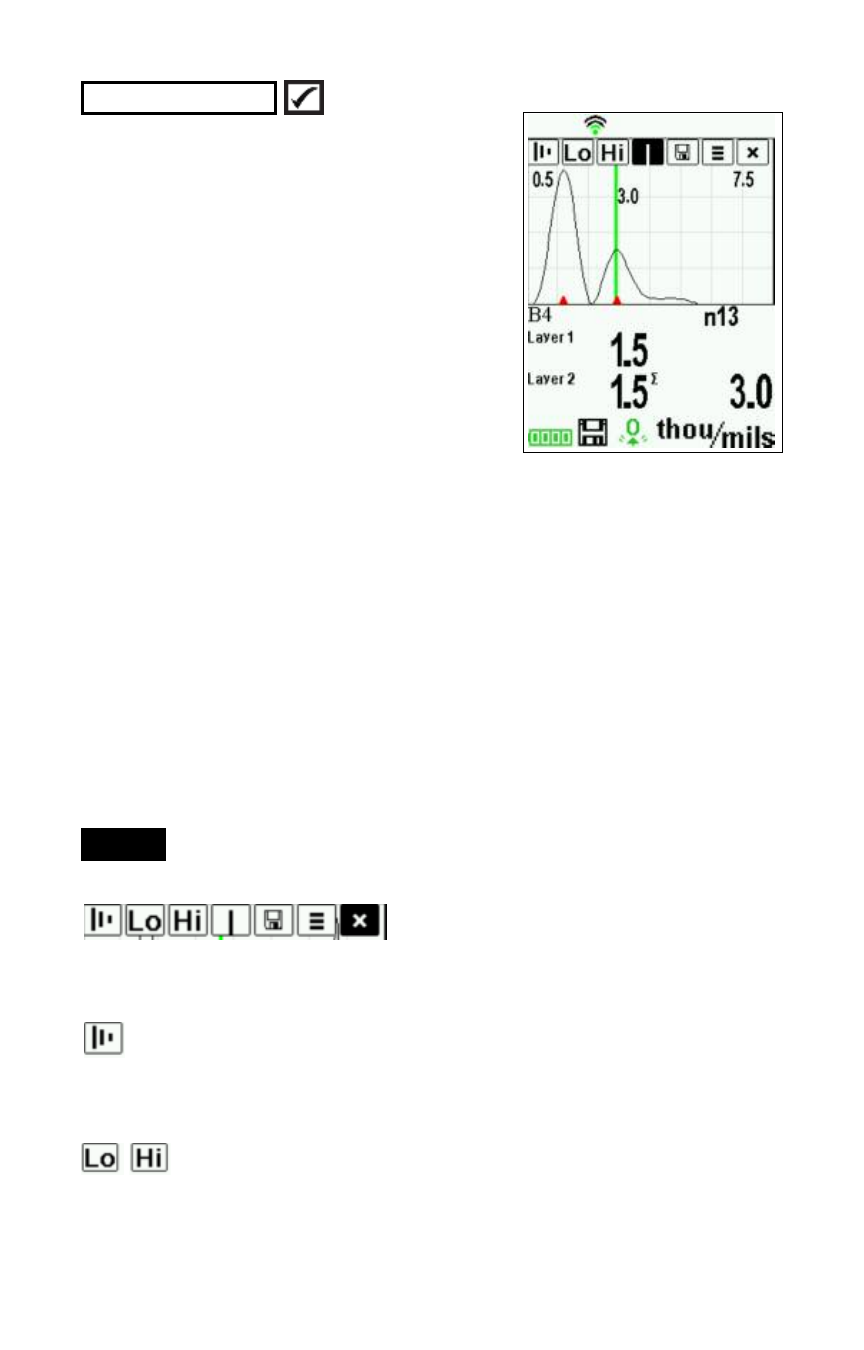
Graphics
When selected, the Gage displays a
graphical representation of the ultrason-
ic pulse as it travels through the coating
system.
As the probe is depressed and the
ultrasonic pulse travels through the
coating system, the pulse encounters
changes in density at the interfaces
between coating layers and between the
coating and the substrate.
These interfaces are depicted by a "peak". The greater the change
in density, the higher the peak. The more gradual the change in
density, the greater the width of the peak. For example, two coating
layers made of essentially the same material and "blended" would
result in a low, wide peak. Two materials of very different density
and a well-defined interface would result in a high, narrow peak.
The PosiTector 200 chooses the highest peak (single layer) or
peaks (multi-layer) within the Set Range. For example, if the
number of layers is set to 3, the three highest peaks would be
identified with small red triangles. The peak values are also
displayed numerically as thickness measurements.
The Graphics display can also be accessed using the
Set Range menu option.
Use the navigation Up (move left) and Down (move right) buttons
to highlight icons on the graphic display.
Zoom - Visually magnifies the waveform of the displayed
peaks for more visibility. Pressing the (+) or (-) button repeatedly
will increase/decrease the zoom.
Set Range - Press the (-) or (+) buttons to adjust the
Gage’s Lo or Hi measuring range. (see pg. 5
)
NOTE:
(Advanced models only)