6 listing (analyzing), 7 output .txt file (analyzing), 8 trend output (analyzing) – LumaSense Technologies IN 6/78-L User Manual
Page 24
IN 6/78-L Operating Manual
Software InfraWin · 24
Note: The measuring values of “measurement online trend” are automatically saved
as "standard.i12". Should you need to edit the data later, you need to save the file as
another .i12-file because old values are over-written when a new measurement is
taken.
Files from older program versions (.i10-files) can be opened and saved as .i12.
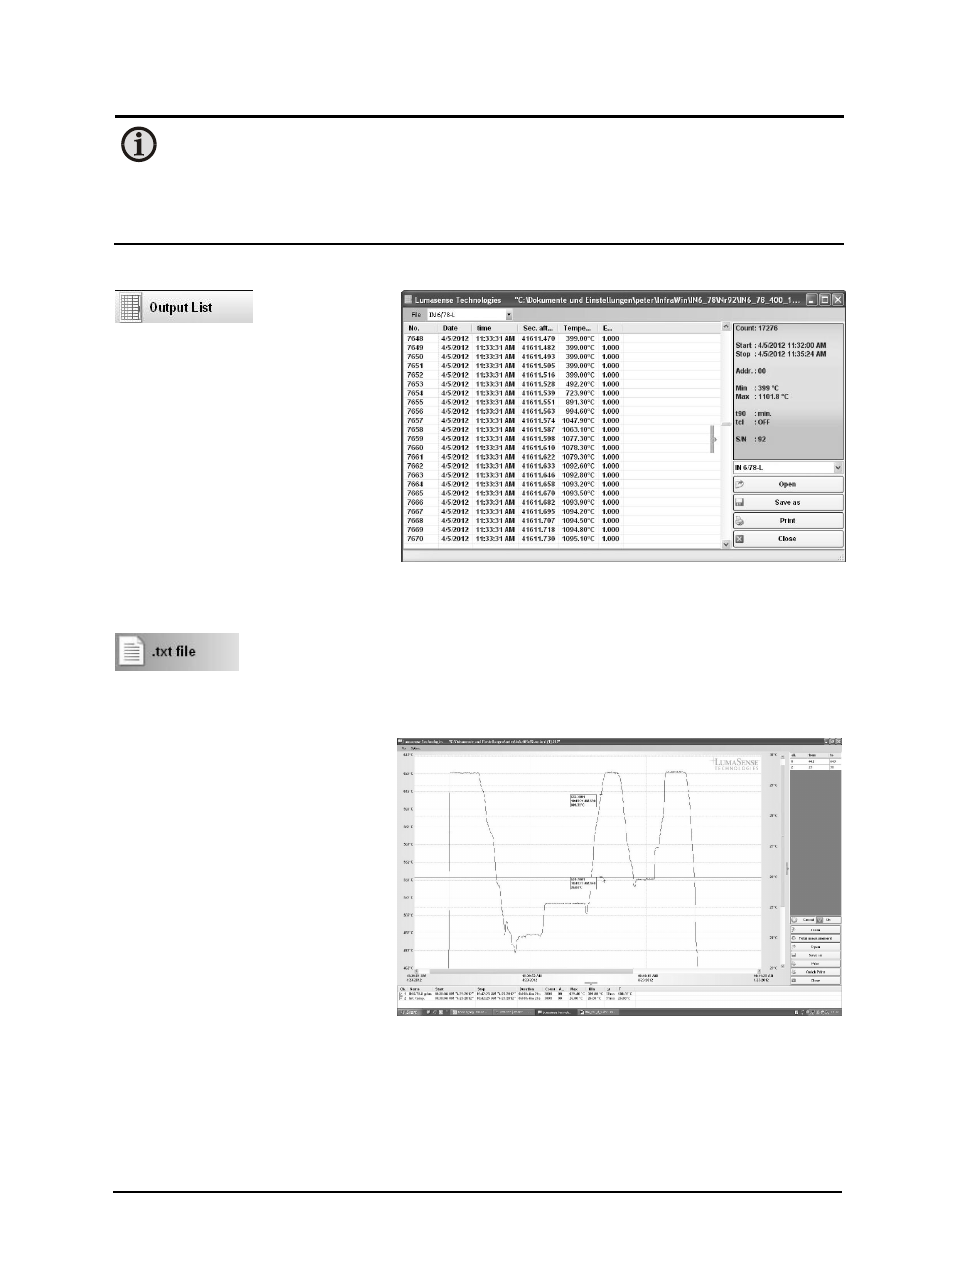
5.6 Listing (analyzing)
For analyzing
the measured
values in this field, all measured
data appears in a numeric list.
The column between time and
temperature provides a time
resolution of milliseconds. The
value specifies the time in seconds
after midnight (0:00 h). The amount
of data depends on the frequency
that readings were taken (settings
at 10.9 PC sampling rates). As the
amount of data increases, so does
the amount of storage space
required to save it. In order to save room, all .i12 data files are stored by a binary code.
5.7 Output .TXT file (analyzing)
The same file as under Output listing may be converted into a text file and
can be easily opened, for example with EXCEL. With the standard import
settings, EXCEL automatically formats the columns accordingly (with tabs as separators).
5.8 Trend output (analyzing)
The graph’s curve depicts the
temperature change over time
within the specified temperature
range.
Additionally, other information
appears in this window; such as
recorded time (x-axis) and
temperature in degrees (y-axis) as
well as the time and temperature
at the vertical cursor line which can
be dragged with the mouse.
Selecting the Trend output initially
causes all the saved data to be
displayed.
If the data exceeds an amount that can be reasonably represented, you may “Zoom“ in on a
partial segment using the mouse (such as the segment represented in the example). Under
“Total” you can return to the representation of the entire curve.