Rice Lake Condec UMC600IS User Manual
Technical bulletin, Umc600is digital weight indicator, Signal strength and grads configuration
November 2000
UMC600IS Digital Weight Indicator
Technical Bulletin
Signal Strength and Grads Configuration
Insufficient signal strength can be an issue in certain
UMC600IS applications, especially when using
multiple load cells. This bulletin describes the effect
of load cell configuration on excitation voltage and
output signal strength, and how changing the grads
configuration can compensate for reduced signal.
Load Cell Configuration Effect on Actual Excitation Voltage
Although the excitation voltage supplied by the
UMC600IS is rated at 5 VDC, the actual excitation
voltage depends on the number and rating of load cells
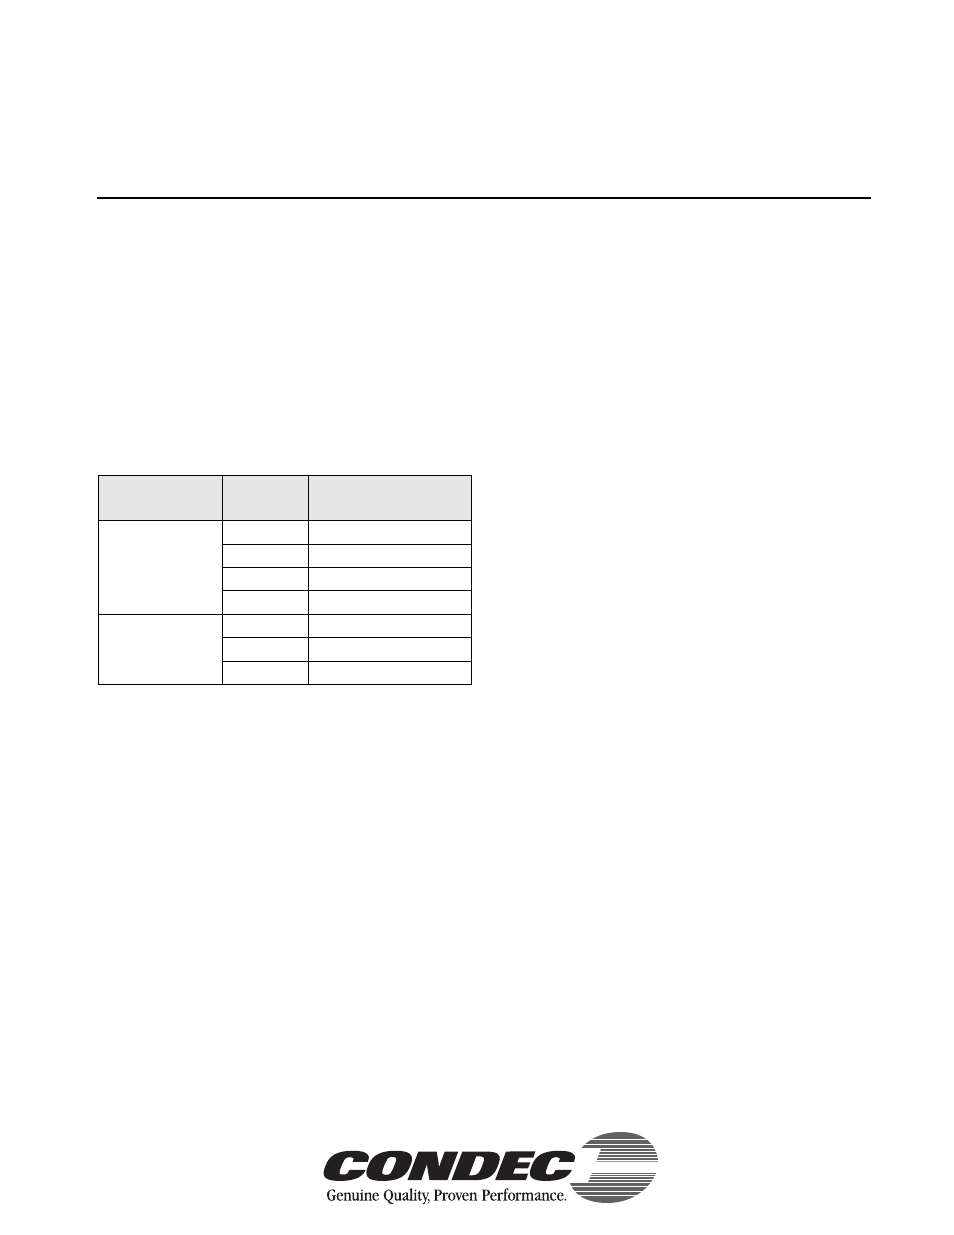
used in the application. Table 1 shows an example of
actual excitation voltage values for several load cell
configurations.
The signal output from a load cell depends on the
excitation input: A 3mV/V load cell can produce 3
mV of signal per volt of excitation supplied to it. If the
excitation voltage is decreased, the signal will also be
decreased. If the excitation voltage drops too far, the
reduced signal output can cause an unstable—or
blank—weight display.
You can check the actual excitation voltage supplied
for your application by using a voltmeter to measure
the voltage between the
+EXC
and
–EXC
terminals at
the junction box.
If you suspect that insufficient signal strength is
causing problems in your application, make the
measurements and calculations described below.
Measuring Signal Strength
Determine the actual signal voltage available to the
indicator by using a voltmeter to measure the voltage
between the
+SIG
and
–SIG
terminals at the junction
box. Measure the signal at no load (deadload) and at
full scale, then determine the amount of live load
signal:
Live load signal = Signal at full scale – Signal at no load
Calculating Signal per Grad
Using the calculated live load signal and the number
of grads configured for the indicator (Parameter 1),
calculate microvolts per graduation (
µ
V/grad):
Signal per grad = Live load signal / Grads
For example, if the difference in signal measurement
from no load to full scale is 4.8 mV and the scale is
configured for 20000 grads:
4.8 mV / 20000 grads
= 0.00024 mV/grad = 0.24
µ
V /grad
I n t h e e x a m p l e a b o v e , t h e v e r y h i g h g r a d s
configuration provides insufficient signal strength for
the UMC600IS, which has an analog signal sensitivity
of 0.3
µ
V/grad.
Configuring the indicator for 1000 grads provides
ample signal strength:
4.8 mV / 1000 grads
= 0.0048 mV/grad = 4.8
µ
V /grad
Summary
The amount of signal available to the indicator is the
result of several factors, including the number of load
cells, rated output of cells, percent of cell capacity
used, excitation voltage, and the grads configured for
the indicator. For many intrinsically safe applications,
the only factor that can easily be changed to
compensate for a low signal level is the grads.
Reducing the number of grads configured increases
the amount of signal per grad and can stabilize an
application.
Load Cell Type
Number of
Cells
Excitation Voltage (VDC)
3mV/V, 350
Ω
1
4.56
2
4.28
3
4.06
4
3.82
2mV/V, 1000
Ω
3
4.39
4
4.24
5
4.10
Table 1. Typical Excitation Voltages Supplied for Various
Load Cell Configurations