Figure 6 – maximum output droop test results – Teledyne LeCroy QPHY-10GBase-T User Manual
Page 19
QPHY-10GBASE-T Operator’s Manual
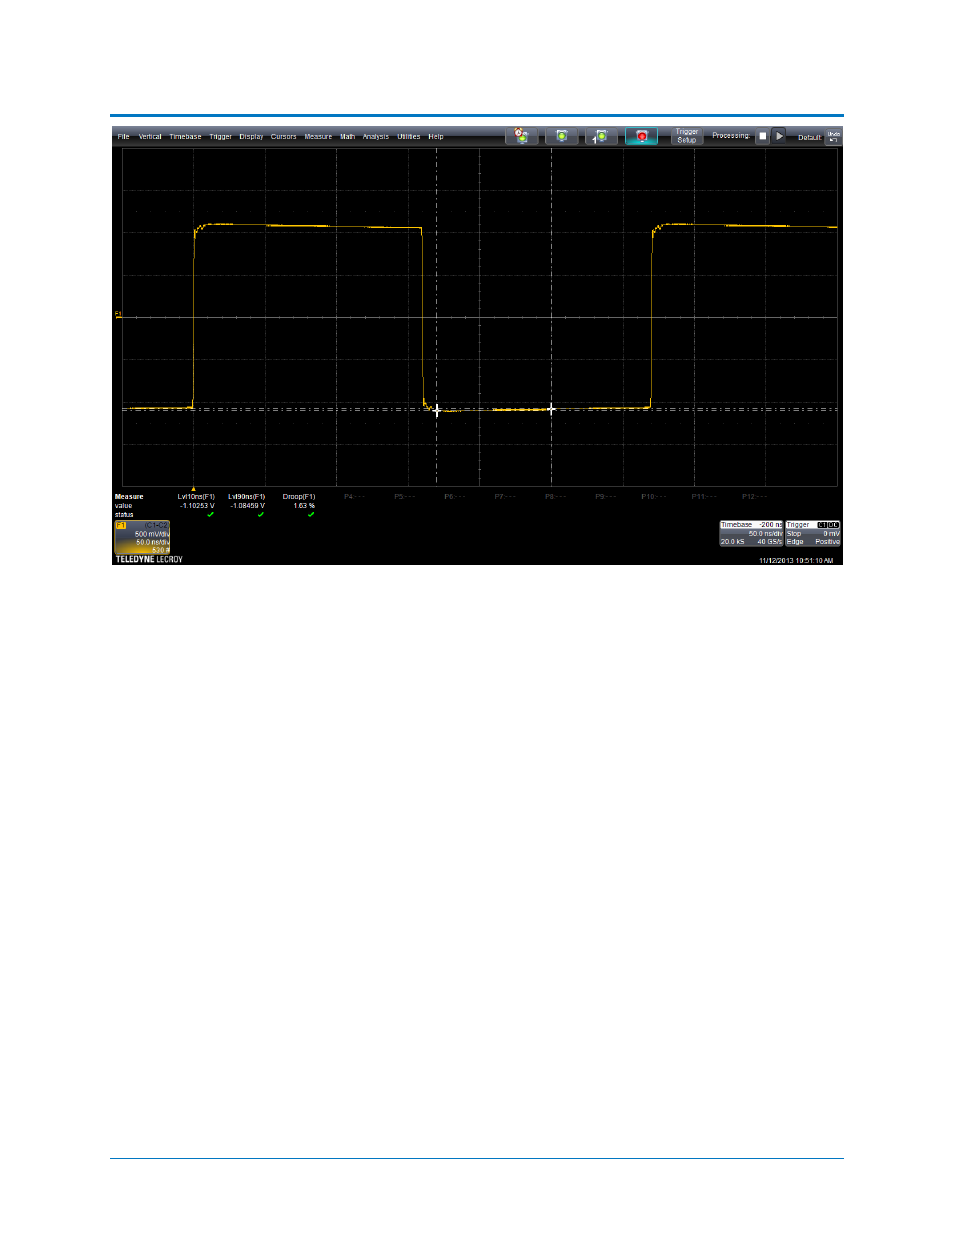
Figure 6 – Maximum Output Droop Test Results
Shown on this screen:
• F1 = C1-C2
• P1 = Lvl10ns, = Level@X where X is T=10ns after the falling edge
• P2 = Lvl90ns, = Level@X where X is T=90ns after the falling edge
• P3 = 100* (P1-P2) / P1, using the processing web
923663 Rev A
15
See also other documents in the category Teledyne LeCroy Software:
- WaveAce EasyScope Operators Manual (28 pages)
- PeRT3 Software Interface (15 pages)
- FireInspector Automation Application Programming Interface (92 pages)
- PETracer ProtoSync Software User Manual (154 pages)
- QPHY-PCIe3-Tx-Rx (32 pages)
- Signal Integrity Studio (14 pages)
- Serial Data Debug Solutions (204 pages)
- Line Code and Symbolic Decoders (20 pages)
- AORM - Advanced Optical Recording Measurements (125 pages)
- CANbus TD - Quick Reference Guide (8 pages)
- CANbus TD and CANbus TDM - Operators Manual (69 pages)
- FlexRay Trigger, Decode and Physical Layer Test (32 pages)
- MIPI D-PHY (15 pages)
- DFP2 - Digital Filter Package 2 (22 pages)
- ET-PMT - Electrical Telecom Pulse Mask Testing (11 pages)
- ENETbusD Decoder (16 pages)
- Eye Doctor II (45 pages)
- JitKit (16 pages)
- JTA2 (31 pages)
- Power Analyzer Package (34 pages)
- QPHY-10GBase-KR (28 pages)
- QPHY-BroadR-Reach (33 pages)
- QPHY-DDR2 (47 pages)
- QPHY-DDR3 (44 pages)
- QPHY-DDR4 (73 pages)
- QPHY-DisplayPort (19 pages)
- QPHY-ENET (78 pages)
- QPHY-HDMI (37 pages)
- QPHY-LPDDR2 (49 pages)
- QPHY-MIPI-DPHY (32 pages)
- QPHY-MOST150 (24 pages)
- QPHY-MOST50 (21 pages)
- QPHY-PCIe (30 pages)
- QPHY-PCIE3 (28 pages)
- QPHY-SAS2 (45 pages)
- QPHY-SAS3 (50 pages)
- QPHY-SATA (45 pages)
- QPHY-USB (66 pages)
- QPHY-USB3-Tx-Rx (47 pages)
- QPHY-UWB (30 pages)
- SDA II (38 pages)
- SDA III-CompleteLinQ (59 pages)
- Spectrum Analyzer (14 pages)
- USB2 Decoder (24 pages)