Key features, Jitkit example – Teledyne LeCroy JitKit User Manual
Page 5
Operator's Manual
Key Features
l
Provides direct display of jitter measurement values, for both clock signals and clock-clock or
clock-data timing.
l
Jitter parameter readouts include maximum positive and negative deviations, worst case devi-
ation, peak to peak, and standard deviation on more than 25 jitter related parameters.
l
Jitter plots show the time domain, frequency domain and statistical domain views of jitter.
l
Time correlated views of input signals and jitter track functions allow easy diagnosis of jitter
sources, while an overlay view provides an intuitive and accurate view of jitter and how it affects a
signal.
l
Quick View provides an instant setup that includes four different views of jitter and the key jitter
parameters.
JITKIT Example
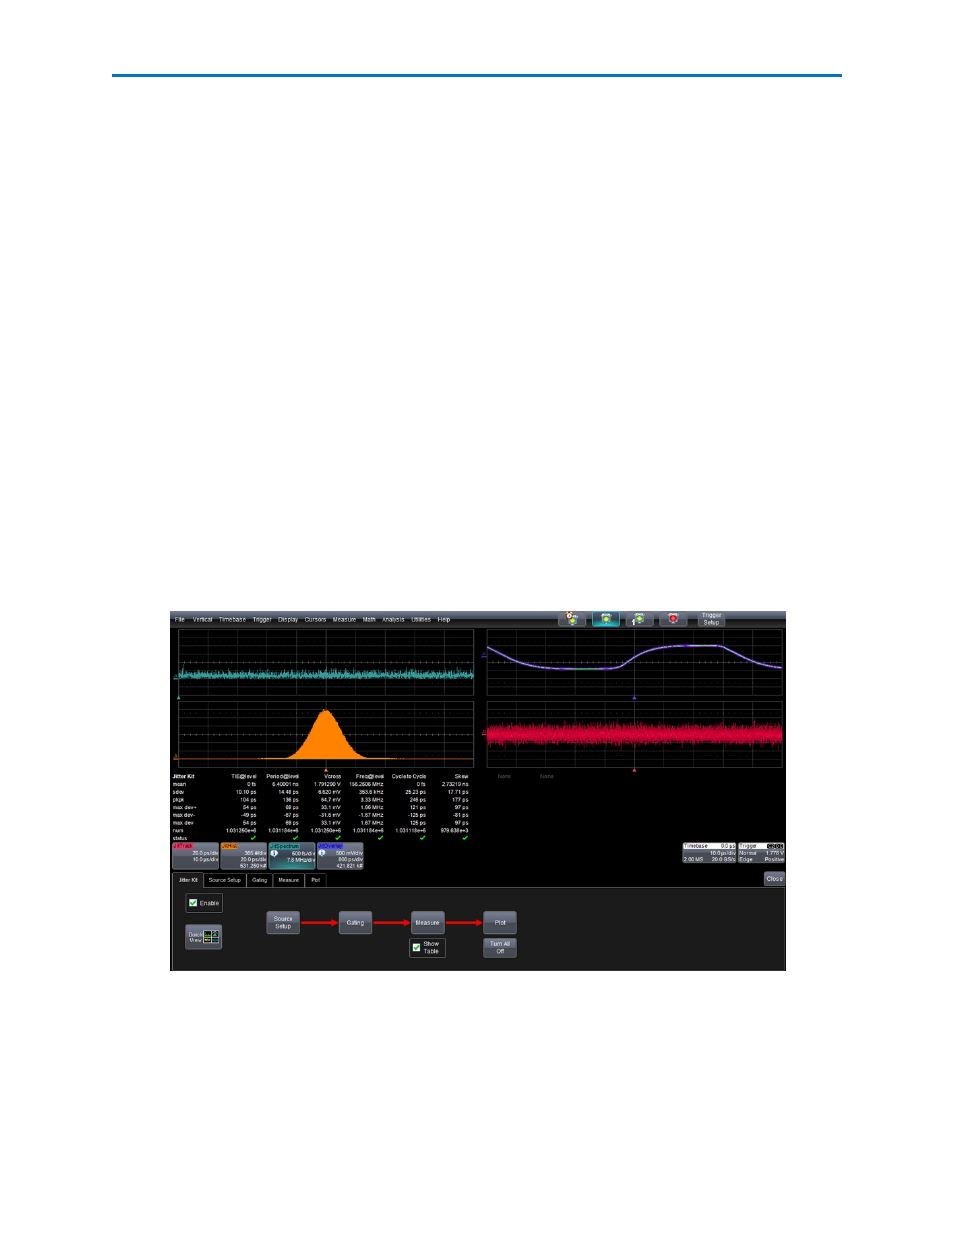
In the following example, measurement parameters for the Time Interval Error (TIE), Period, and Cycle-
to-Cycle period jitter are displayed along with the crossing voltage (Vcross) of the differential input
components, frequency, and skew. The measurement table includes the mean value, standard deviation
(rms jitter), peak to peak jitter, maximum positive deviation from the mean, maximum negative
deviation, and the maximum or worst case deviation. It also reports the number of measurements
included in the statistics. The jitter plots include the Jitter Histogram of TIE, the Jitter Track of TIE (which
shows TIE as a function of time), the Jitter Spectrum showing the frequency distribution of jitter values,
and the Jitter Overlay, a persistence display of the input waveform on a cycle by cycle basis.
Analysis of a 156.25 MHz differential clock signal including a) jitter measurements, b) views of
jitter in the time, frequency and statistical domains, and c) the jitter overlay.
922810 Rev A
3