American Power Conversion MatrixTM UPS User Manual
Page 37
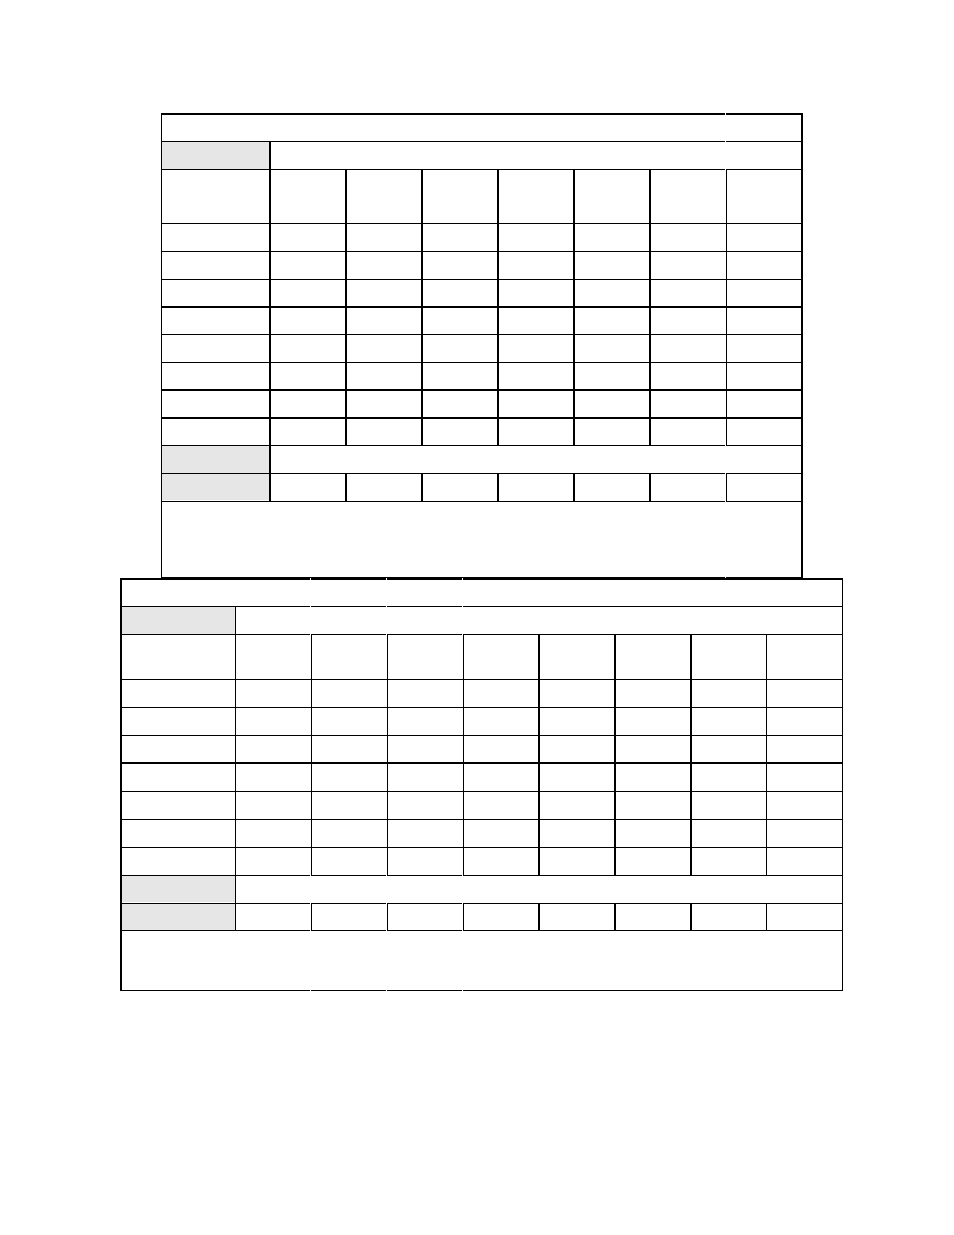
Typical On-Battery Run Time Versus Load, 5000 VA Matrix-UPS with SmartCells, in Hours
Number of SmartCells
Computer Load
(VA)
2
3
4
5
6
7
8
500
3.07
5.02
7.20
9.38
11.56
13.75
15.93
1000
1.46
2.46
3.52
4.58
5.80
7.02
8.24
1500
0.83
1.46
2.11
2.81
3.52
4.23
4.99
2000
0.57
0.99
1.46
1.93
2.46
2.99
3.52
2500
0.46
0.78
1.18
1.59
1.99
2.45
2.90
3000
0.36
0.62
0.92
1.25
1.59
1.92
2.30
4000
0.24
0.42
0.62
0.83
1.08
1.33
1.59
5000
0.17
0.31
0.46
0.62
0.78
0.98
1.18
Recharge Time, in Hours
2.8
2.7
3.8
4.9
6
7
8.1
The case of one SmartCell does not apply to 5000 VA Matrix-UPS.
Calculations based on loads with a .75 power factor. Lower power factor loads will yield higher run times.
Run times are typical at 25° C (77° F).
Recharge times to 90% of rated capacity after discharge into 50% of rated load.
Typical On-Battery Run Time Versus Load, 5000 VA Matrix-UPS with SmartCell XR Battery Packs, in Hours
Number of SmartCell XR Battery Packs
Computer Load
(VA)
1
2
3
4
5
6
7
8
1000
3
6.75
10.75
14.75
18.75
22.75
26.75
30.75
1500
1.8
4.3
6.9
9.5
12.1
14.7
17.3
19.9
2000
1.2
3
5
7
9
11
13
15
2500
0.9
2.4
4
5.6
7.2
8.8
10.4
12
3000
0.75
1.8
3.25
4.7
6.15
7.6
9.05
10.5
4000
0.53
1.25
2.25
3.25
4.25
5.25
6.25
7.25
5000
0.37
0.9
1.6
2.4
3.2
4
4.8
5.6
Recharge Time, in Hours
3.8
8.1
12.5
16.9
21.3
25.7
30.1
34.5
Calculations based on loads with a .75 power factor. Lower power factor loads will yield higher run times.
Run times are typical at 25° C (77° F).
Recharge times to 90% of rated capacity after discharge into 50% of rated load.