Acid-base titration (alternative method) – PASCO PS-2117 Drop Counter User Manual
Page 3
M o d e l N o . P S - 2 1 1 7
3
8.
Observe the data on the pH versus Fluid Volume graph.
After the equivalence point is reached, continue collect-
ing data until the pH curve flattens.
9.
Close the stopcock valve and stop data recording.
Acid-Base Titration (Alternative Method)
Procedure
1.
Set up the equipment and consumables as illustrated.
Attach both stopcocks to the syringe, and attach the drop
tip to the bottom stopcock. Line up the drop tip with the
rectangular opening in the Drop Counter.
2.
Start with the valves of the stopcocks turned parallel to
the table top. Add the solutions to the syringe and bea-
ker.
3.
Write down the initial volumes of both solutions (in the
syringe and in the beaker), and the molarity of the titrant
(in the syringe).
4.
Connect the Drop Counter and pH sensor to your
PASPORT compatible PASCO interface (or interfaces).
5.
If you are using a computer, connect the interface to it
and start the data acquisition software. Set up a graph
display of pH versus Drop Count.
6.
Start the stir plate.
7.
Touch, press, or click to begin recording data.
8.
Open the top stopcock. Slowly adjust the bottom stop-
cock to start delivering titrant at about 2 drops per sec-
ond.
9.
Observe the data appearing on the pH versus drop count
graph. After the equivalence point is reached, continue
collecting data until the pH curve flattens.
10. Close the stopcocks.
11. Stop data recording.
12. Read the final volume of fluid in the syringe and calcu-
late the net volume of titrant that was dispensed.
13. Read the final drop count on the graph.
14. In the calculator window of the software or datalogger,
enter a calculation as shown below, but using your own
values of total volume dispensed and final drop count.
The calculation gives the volume of titrant dispensed
over time based on the number of drops and the average
volume per drop.
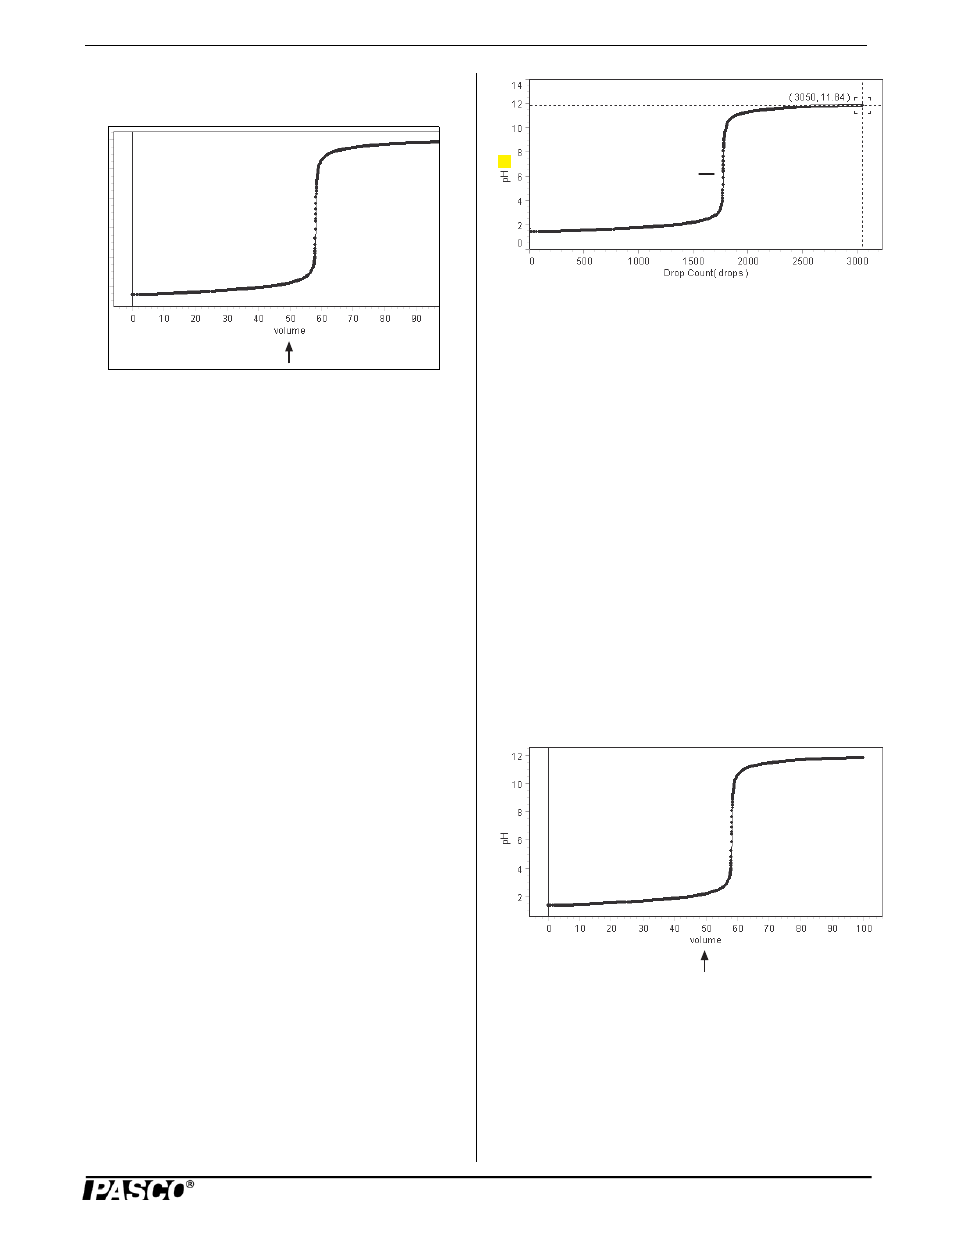
volume = [Drop Count (drops)] * 100/3050
In this example, “100” is the total volume dispensed (in
mL) and “3050” is the final drop count.
15. In the graph, change the horizontal axis to the calculated
“volume”.
Select fluid volume for
horizontal axis.
equivalence point
final drop count
Select volume calculation
for horizontal axis