7general ltp-director software features, 1 display toolbar for single channel view – Multichannel Systems LTP-Director Manual User Manual
Page 73
69
7
General LTP-Director Software Features
7.1
Display Toolbar for Single Channel View
Double-click on one channel of the data display. The window will be enhanced and you will find
several options for dealing with the data. Several tools for zooming and scrolling the data as well
as exporting the graph are provided on the toolbar of the enhanced online display.
Enable
scrolling
Scroll the axes by clicking and dragging with your mouse or by pressing
keys on your keyboard.
Enable
zooming
Zoom the axes by clicking and dragging with your mouse or by pressing
keys on your keyboard.
Zoom in
Zoom all axes in.
Zoom out
Zoom all axes out.
Zoom box
Zoom in a particular region of the display. The box can start at any
point, but must be dragged to the lower right to actually cause a zoom.
Show/hide
data cursors
Show a vertical cursor / crosshair. The cursor shows the x- and y-values
for the trace line of the assigned channel. By right clicking on the
cursor, a context menu is displayed where you can change the channel
assignment.
ASCII export
Exports display contents in ASCII file format.
Snapshot
Exports display contents in graphic file format.
7.1.1
Scrolling and Zooming
Scrolling and zooming with the mouse wheel
1.
Click an axis to select it.
This is indicated by a tiny black line around the selected axis.
2.
Use the mouse wheel to scroll the axis.
- OR -
Keep pressing the left mouse and move the mouse to scroll the axis.
3.
Press the CTRL key at the same time for zooming the axis.
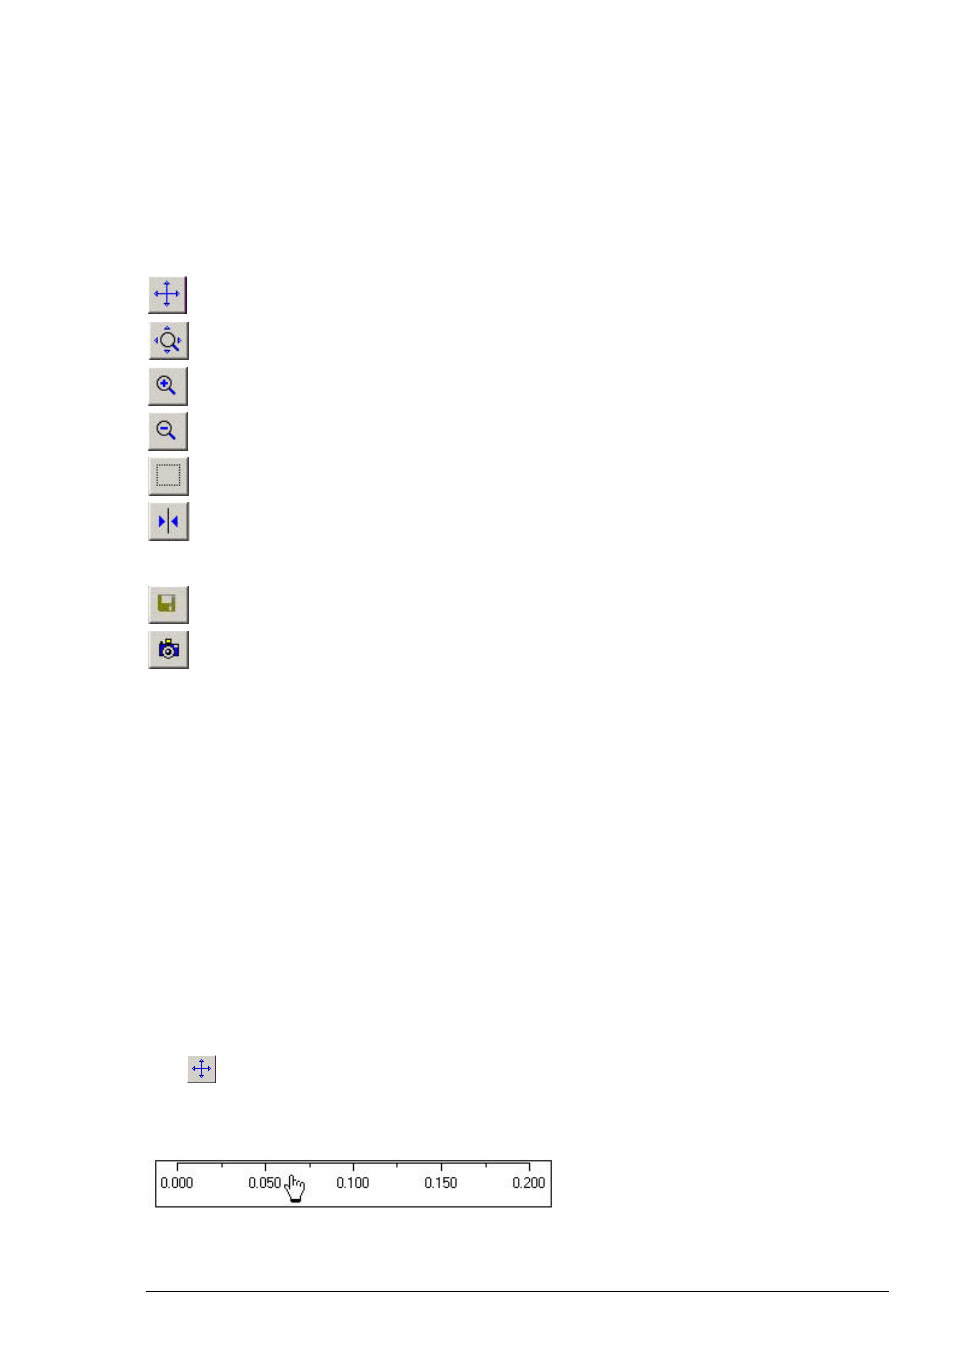
Scrolling with the mouse or keyboard
1.
Click
to enable the scrolling.
2.
Click the axis you like to scroll.
The mouse pointer becomes a hand. The unit of this axis will appear as a tool tip.