2 configuration of the view styles, View menu – Hach-Lange ORBISPHERE 410 User Manual User Manual
Page 43
41
View Menu
5.2 Configuration of the view styles
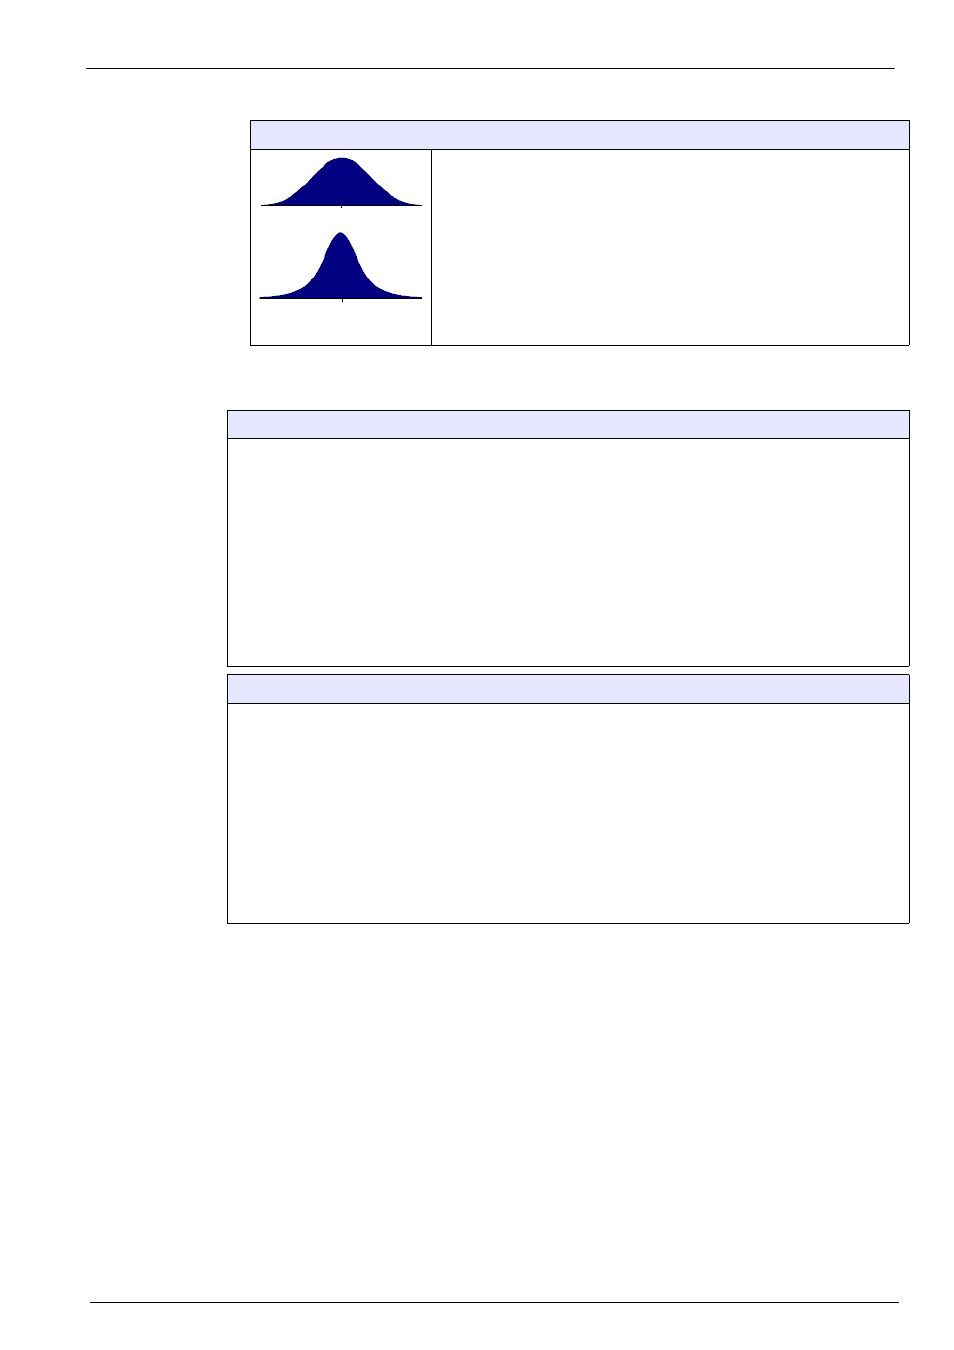
Kurtosis
Figure 28 Kurtosis
Kurtosis is a parameter that describes the shape of a random variable’s
probability distribution.
The graphs on the left illustrate the notion of kurtosis. The lower curve
has higher kurtosis than the upper curve. It is more peaked at the center,
and it has fatter tails
Numeric view configuration
List of parameters that can be adjusted to customize the numeric view display:
•
Display temperature
: no, channel temperature
•
Display mini graph
: yes/no
•
Display time base
: yes/no
•
Upper bound
: Adjust graph upper limit
•
Lower bound
: Adjust graph lower limit
•
Time base
: Adjust graph time span
•
Grid button
: Set up the graph to display the x or y axes, the grid, or the thresholds
•
Auto Scale update
: Automatically set the graph upper and lower bounds to best fit the actual values
displayed.
•
Clean button
: Clear the slope displayed. The slope restarts from the left side.
Statistic view configuration
Scope:
•
Number of values
: Statistic calculation range (from 10 to 1,000 values). Number of value taken in
consideration in the log file since last value stored. The recorded values with alarms are not
considered for calculation, but are part of the log file.
Histogram:
•
Upper limit
: Select High or High High alarm value, or a custom value.
•
Lower limit
: Select Low or Low Low alarm value, or a custom value.
Capability:
•
Upper limit
: Select High or High High alarm value, or a custom value.
•
Lower limit
: Select Low or Low Low alarm value, or a custom value.