Vortex, P.27, 6 typical performance diagrams – Camco Vortex 8 User Manual User Manual
Page 28: S i lv e r se r i es
VORTEX
S I LV E R SE R I ES
-3
+0.5
-2.5
-2
-1.5
-1
-0.5
+0
d
B
r
A
20
50 k
50
100
200
500
1k
2k
5k
10 k
20 k
Hz
-90
-40
-85
-80
-75
-70
-65
-60
-55
-50
-45
d
B
-60
+10
-50
-40
-30
-20
-10
+0
dBu
0
-180
+180
-160
-140
-120
-100
-80
-60
-40
-20
+20
+40
+60
+80
+100
+120
+140
+160
d
e
g
10
100k
20
50
100 200
500
1k
2k
5k
10k 20k
50k
Hz
-90
-40
-85
-80
-75
-70
-65
-60
-55
-50
-45
d
B
-60
+10
-50
-40
-30
-20
-10
+0
dBu
USER MANUAL
VORTEX SILVER SERIES V8
P.27
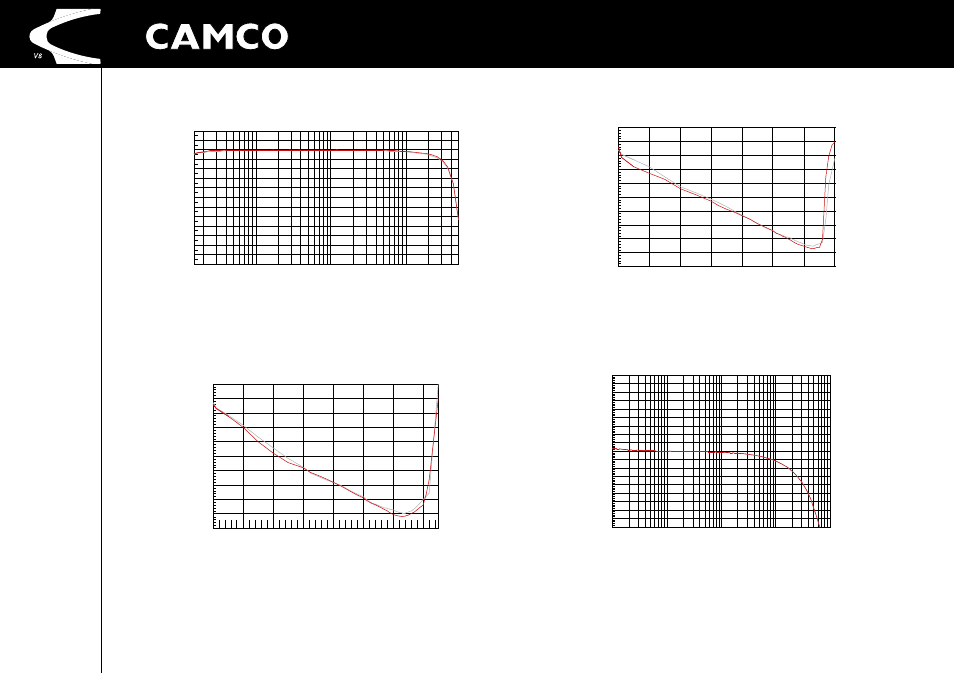
Figure 6.1
Gain vs. frequency, 120 W output power, 4 Ω (channel 1,
channel 2
)
(Measurement of a typical performance)
Figure 6.3
THD @ 1 kHz, 2 Ω vs. input voltage (channel 1,
channel 2
)
(Measurement of a typical performance)
Figure 6.2
THD @ 1 kHz, 4 Ω vs. input voltage (channel 1,
channel 2
)
(Measurement of a typical performance)
Figure 6.4
Phase vs. frequency (channel 1,
channel 2
)
(Measurement of a typical performance)
6 TYPICAL PERFORMANCE DIAGRAMS