Test port output – Atec Rohde-Schwarz-ZNC User Manual
Page 8
Version 03.00, September 2012
8
Rohde & Schwarz R&S
®
ZNC Vector Network Analyzer
Test port output
This data is valid from +18 °C to +28 °C.
Power range
without R&S
®
ZNC3-B22 extended power range option
9 kHz to 100 MHz
–10 dBm to +10 dBm, typ. +12 dBm
100 MHz to 3 GHz
–10 dBm to +10 dBm, typ. +13 dBm
Power range
with R&S
®
ZNC3-B22 extended power range option
9 kHz to 100 MHz
–50 dBm to +10 dBm, typ. +12 dBm
100 MHz to 3 GHz
–50 dBm to +10 dBm, typ. +13 dBm
Power accuracy
source power –10 dBm
9 kHz to 50 kHz
< 3 dB
50 kHz to 3 GHz
< 2 dB, typ. 0.5 dB
Power linearity
referenced to –10 dBm
source power ≥ –35 dBm
< 1 dB
source power < –35 dBm
< 2 dB
Power resolution
0.01 dB
Harmonics
at 0 dBm
20 kHz to 100 MHz
typ. < –30 dBc
100 MHz to 3 GHz
< –25 dBc, typ. < –30 dBc
10
-2
10
-1
10
0
10
1
10
2
10
3
6
8
10
12
14
16
18
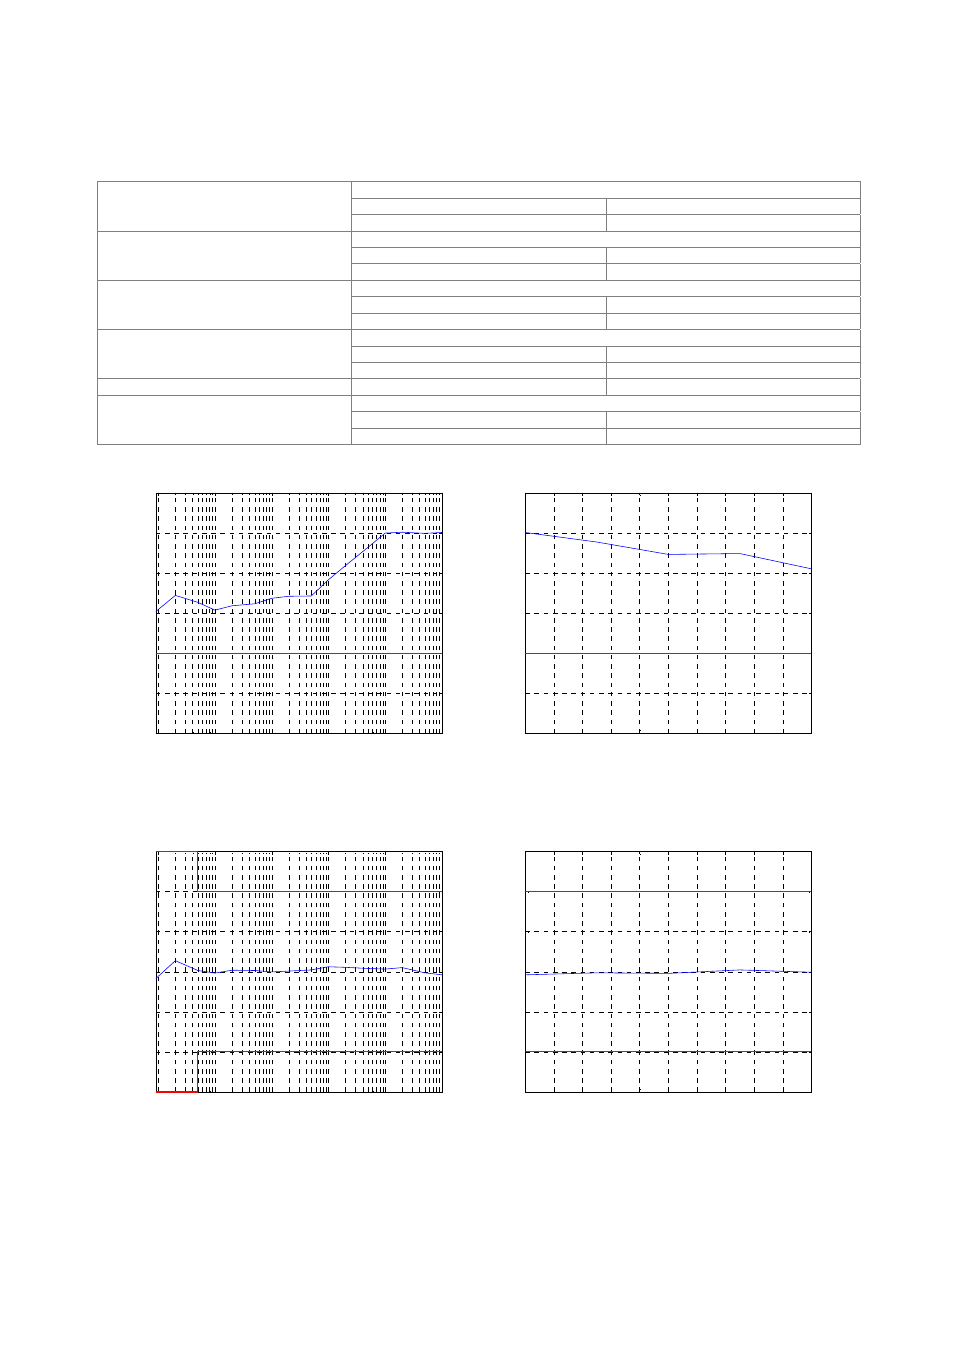
Frequency in MHz
Max
imum ou
tput pow
er i
n dB
m
1
1.2
1.4
1.6
1.8
2
2.2
2.4
2.6
2.8
3
6
8
10
12
14
16
18
Frequency in GHz
Max
imum ou
tput pow
er i
n dB
m
Maximum output power in dBm versus frequency for the R&S
®
ZNC3.
10
-2
10
-1
10
0
10
1
10
2
10
3
-3
-2
-1
0
1
2
3
Frequency in MHz
A
cc
urac
y of o
utput pow
er i
n dB
1
1.2
1.4
1.6
1.8
2
2.2
2.4
2.6
2.8
3
-3
-2
-1
0
1
2
3
Frequency in GHz
A
cc
urac
y of o
utput pow
er i
n dB
Output power accuracy in dB versus frequency for the R&S
®
ZNC3.