Applications, Log the most common parameters, Easy to use – Atec Fluke-1735 User Manual
Page 2
Fluke Corporation 1735 Three-Phase Power Logger
Applications
Load studies – verify electrical
system capacity before adding
loads
Energy assessments – quantify
energy consumption before, and
after improvements, to justify
energy saving devices
Harmonics measurements –
uncover harmonic issues that
can damage or disrupt critical
equipment
Voltage event capture – moni-
tor for dips and swells that cause
spurious resets or nuisance
circuit breaker tripping
Log the most common
parameters
Designed to measure the most
critical three-phase power
parameters, the 1735 can log rms
voltage, rms current, phase angle,
voltage events, voltage and cur-
rent THD, voltage and current
harmonics up to the 50th, active
power, reactive power, power
factor, active energy, reactive
energy, and more. With memory
for up to 45 days of data, the
1735 can uncover intermittent or
hard-to-find issues.
Easy to use
The four current probes are
connected with one plug, the
instrument automatically detects,
scales and powers the probes.
These variable range current
probes are easily set to 15 A,
150 A, or 3000 A for high accu-
racy in nearly any application.
The voltage connections are
single leads, enabling easy and
quick setups. The color screen
provides instant confirmation that
connections are correct, and then
logging begins when you press
the RECORD button.
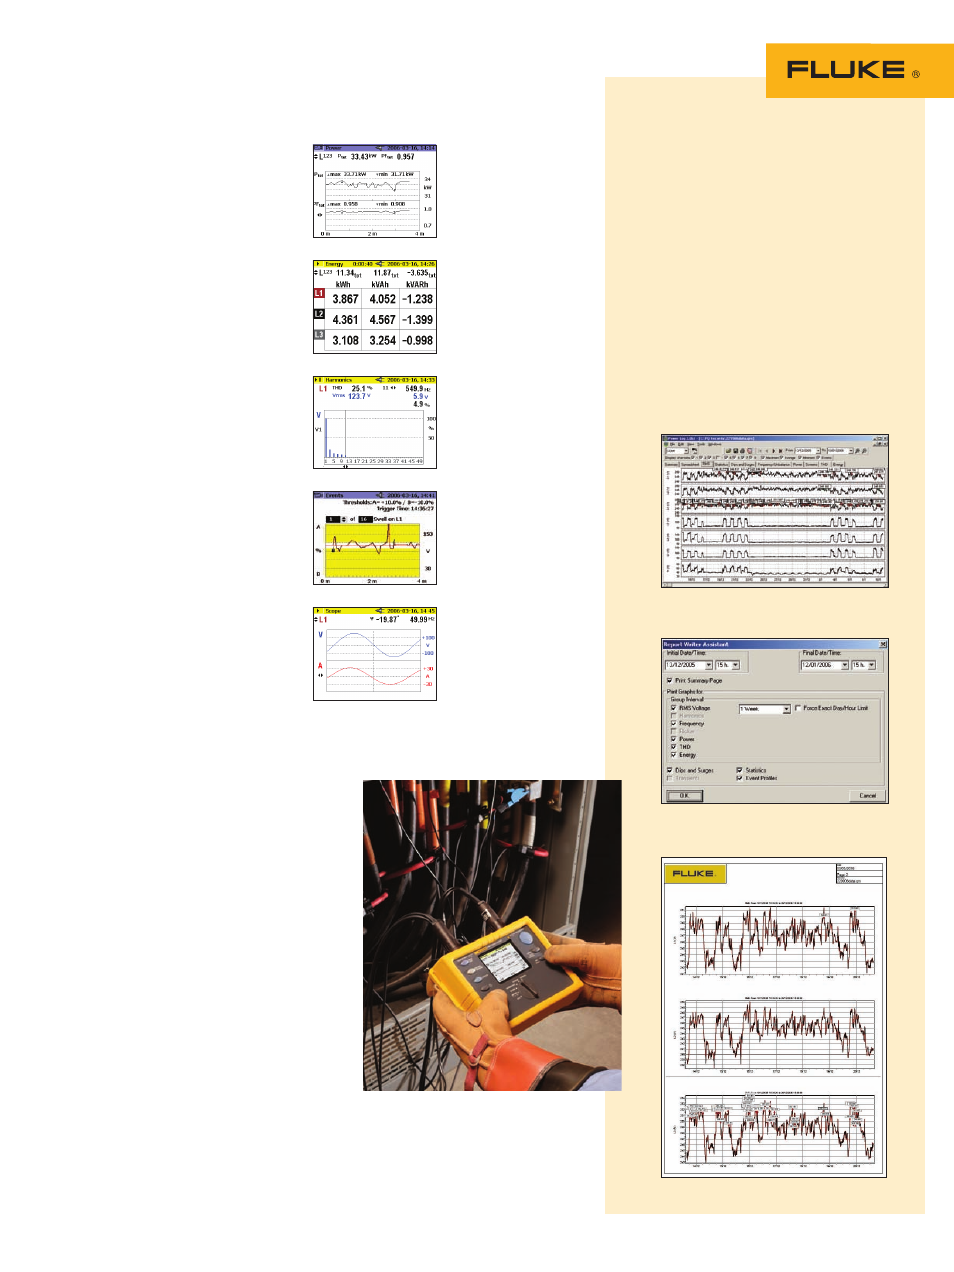
Conduct load studies for up
to 45 days and view saved
data on-screen or on a
computer.
Quantify energy consump-
tion quickly on-screen or
log to memory for extended
periods.
Assess voltage and current
harmonics up to the 50th.
Capture voltage events using
user-defined thresholds.
View waveforms on-
screen to uncover
waveform distortion and
to verify correct voltage
and current connections.
View recorded data in simple graphs and tables.
Easily customize the report.
Generate reports and view
graphs with Fluke Power
Log Software
Designed to quickly view recorded
data, the included Power Log software
displays all recorded parameters on
interactive trends. Generate a profes-
sional report with the ‘Report Writer’
function, or copy and paste images into
report document manually.
Create professional reports.