Personal and area monitors, Determining location and area coverage, T.o.c – Atec Narda-8800 Series User Manual
Page 5: A level of 10mw/cm, Previous next
Personal and Area Monitors
///////////
435 MORELAND ROAD HAUPPAUGE, NY 11788
USA TEL: 516 231-1700 INTL TEL: (1) 516 231-1390 FAX (1) 516 231-1711
E-MAIL: [email protected] www.nardaeast.l-3com.com
DETERMINING LOCATION AND AREA COVERAGE
To calculate where an area monitor should be mounted,
various considerations are necessary. They include:
1. Areas where personnel are likely to be present
2. Probable radiation emanation point (or points)
3. Size of the area to be monitored
4. Safety standard level being used
5. Frequency and wavelength
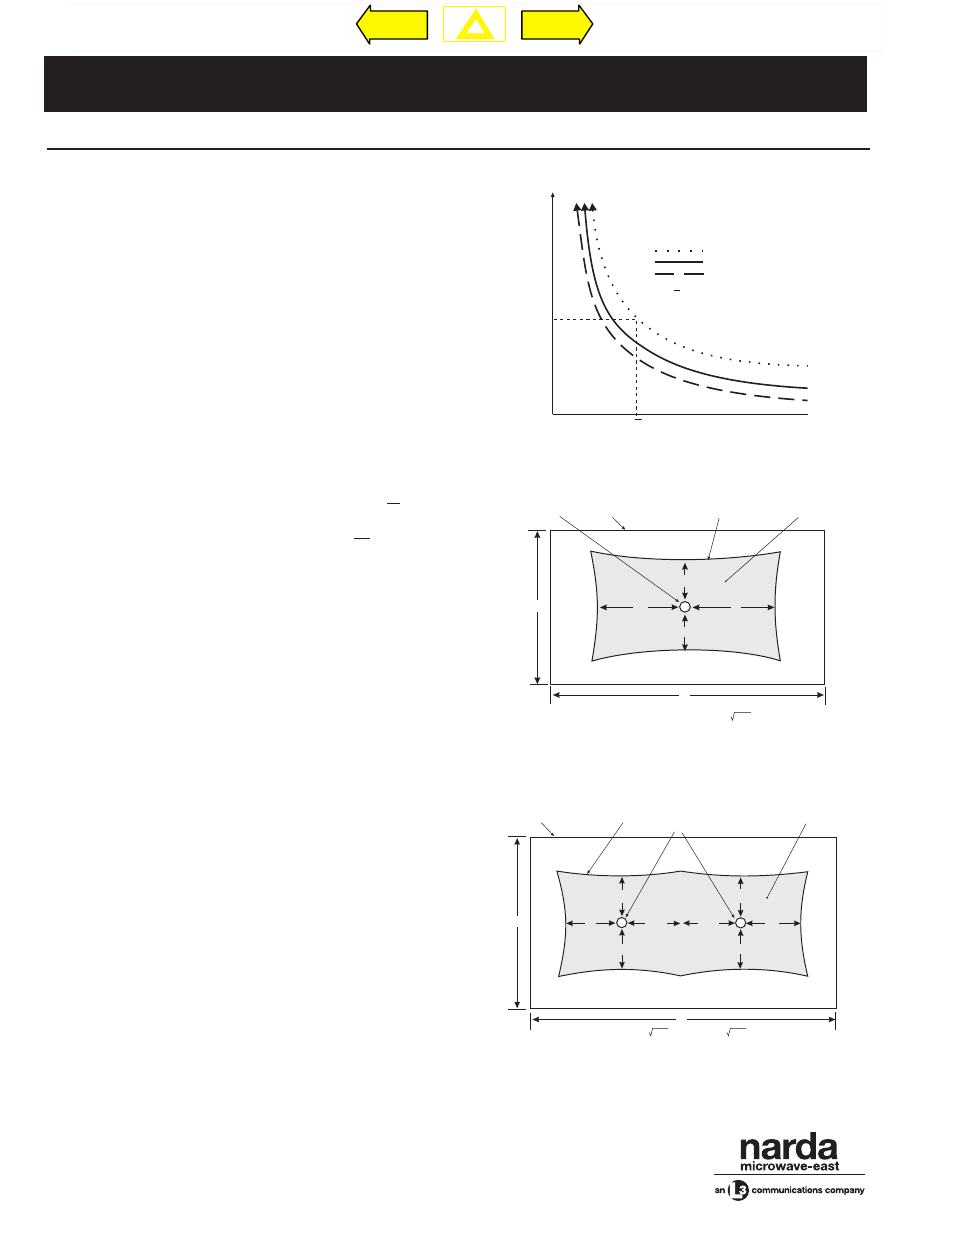
Figure 2 shows the typical relationship between distance
and the reduction of the field strength in terms of equiva-
lent power density in the far field. When calculating the
area a SMARTS can effectively monitor, first determine
where the unit is to be mounted and what the alarm thresh-
old level is. The minimum protection area is based on the
assumption that the energy at the source of a leak will not
be known. For example, if the SMARTS was located 10
feet (“X”) from the source of the energy and it reached its
threshold of 1mW/cm
2
, a level of 10mW/cm
2
(the stan-
dard) would be present at a distance of 3.16 feet (
√
x ) from
the source. Therefore, the minimum protected area would
be all points at a distance less than 6.84 (x-
√
x ) feet from
the SMARTS. If a failure results in a higher or lower
amount of energy at the source, then one could calculate
an even smaller “unprotected” area.
Most safety standards average exposure over a period of
six minutes. Therefore, an additional safety margin exists
since the SMARTS sounds its alarm in less than one sec-
ond and corrective action could be enacted quickly by re-
moving power or exiting the area).
Figures 3 and 4 represent a shelter-mounting application.
Figure 3 shows one SMARTS and its associated “safe”
zone. Figure 4 denotes the same shelter but with two
SMARTS installed. It may be advisable to use multiple
monitors depending on where the high power is gener-
ated or routed.
1
2
3
4
5
6
7
8
9
10
0.5
1.0
5.0
10
50
100
500
1000
mW/cm
2
1.0 mW/cm
2
0.5 mW/cm
2
0.2 mW/cm
2
Relative Distance (D)
Equivalent Power Density (S)
S at
√
D = 10
•
S at D
√
10
1.0
0.5
0.2
÷
1/2X
A=1/2Y-
÷
1/2Y
Y
X
*
Protected Area
or "Safe" Zone
Energy Source
Location Anywhere
on This Perimeter
SMARTS
(at 1/10 of Std.)
Point Where Energy
is 10 Times
Level at SMARTS
A
A
B
B
A=1/2Y- 1/2Y
B=1/2X- 1/2X
A=1/2Y- 1/2Y
B=1/2X- 1/2X
Y
X
*
*
Protected Area
or "Safe" Zone
Energy Source
Location Anywhere
on This Perimeter
SMARTS
(at 1/10th of Std.)
Point Where Energy
is 10 Times
Level at SMARTS
A
B
B
B
B
A
1/4Y
1/4Y
It is always best to make actual measurements before in-
stallation since calculations cannot account for the vari-
ous objects that can perturb the field. Measurements are
more critical when determining the mounting position for
the Models 8810 and 8815 as they may be located in the
near field, where field strengths are very difficult to calcu-
late. When monitoring a test stand where the energy
would leak from a defined area, the SMARTS should al-
ways be placed as close as possible to the operator or
technician. Ideally, the SMARTS and the person should
be located the same distance from the source.
Figure 2. Equivalent Power Denisity versus Distance from Source
Figure 3. Single SMARTS Installation
Figure 4. Dual SMARTS Installation
%
Previous
Next
T.O.C.