Cla-Val X133 User Manual
X133, Flow measuring system
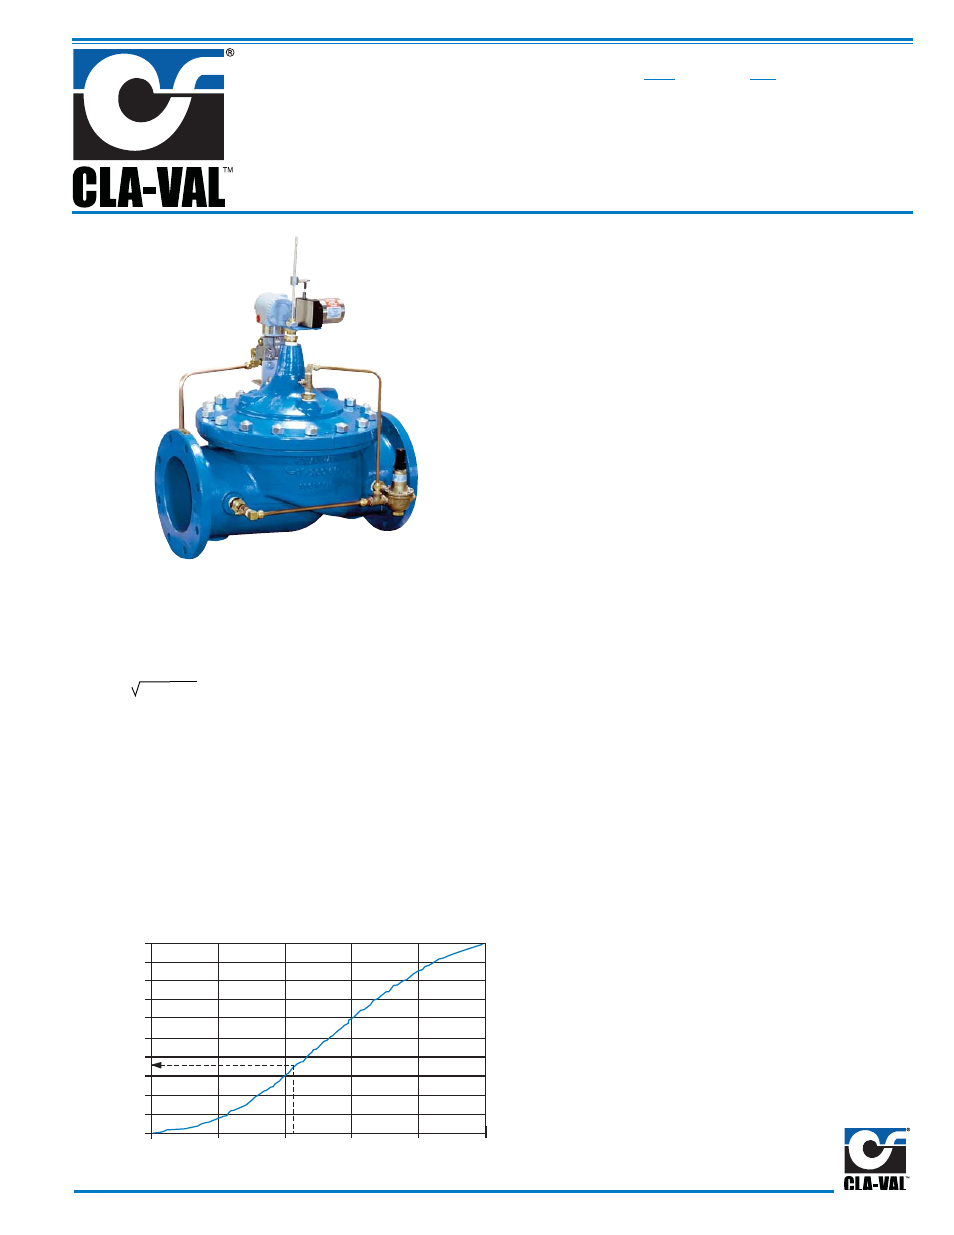
X133
Flow Measuring System
The X-133 Flow Measuring System provides an econom-
ical and precise method of getting flow rates from control
valves at field sites via an RTU to the SCADA control center.
It is a completely self contained system that, when factory
installed on new Cla-Val hydraulic control valves or field
installed as a kit on existing valves, accurately measures
flow rate. It can be used on globe pattern valves from
three through twenty-four inch size and is typically used
on pressure reducing, back pressure, flow limiting, pump
control and level control valves. *
The Flow Measuring System consists of a position transmitter,
differential or inlet & outlet pressure transducers and a
diskette containing the appropriate flow curve information
for a particular valve size and configuration.
The Flow Measuring System uses certified flow curves
that have been derived from pressure and flow tests for
this particular flow application. They have been generated
using pressure transducers located at the valve inlet and
outlet bosses and on the pipe adjacent to the valve. This
provides the versatility to be used in virtually all applications
and operating conditions.
(*For applications requiring flow measurement and
remote set point control, see 133-01 Metering Valve
brochure.)
MODEL
•
Accurately Measures Flow Rate
•
Reduces System Cost -
No External Meter Required
•
Ideal for New Installations and
Retrofitting Existing Valves
•
Completely Self-Contained -
Requiring Only Transmitter Loop Power
•
Simple Information Integration into
RTU / PLC or SCADA software
To measure flow rate, the flow curve, once downloaded in
the RTU containing custom curve capabilities or directly
into the SCADA software, accepts valve position from the
position transmitter, which determines the valve Cv. The
flow rate is then calculated using the formula:
Where:
Q = flow (gpm)
DP = differential pressure (psi)
SG = specific gravity of fluid (water = 1.0)
The Cv is acquired from the valve curve provided on the
diskette. The Cv is given in tabular format from 1 to 100%
valve position in increments of 1% and in graphical format.
The following is a typical curve. In the example shown at
43% open the valve has a Cv, which is 37% of the maximum.
100
100
90
80
80
70
60
60
50
40
40
30
20
20
10
0
0
Percent Wide Open Cv
Position (%)
Q = C
v DP / SG