Advance datasheet, Typical performance characteristics (continued), Vs. ambient temperature vs. supply voltage – Diodes AP2820 User Manual
Page 11
Advance Datasheet
High-side Power Distribution Switch with Enable and Flag AP2820
Jul. 2012 Rev 1. 7 BCD Semiconductor Manufacturing Limited
11
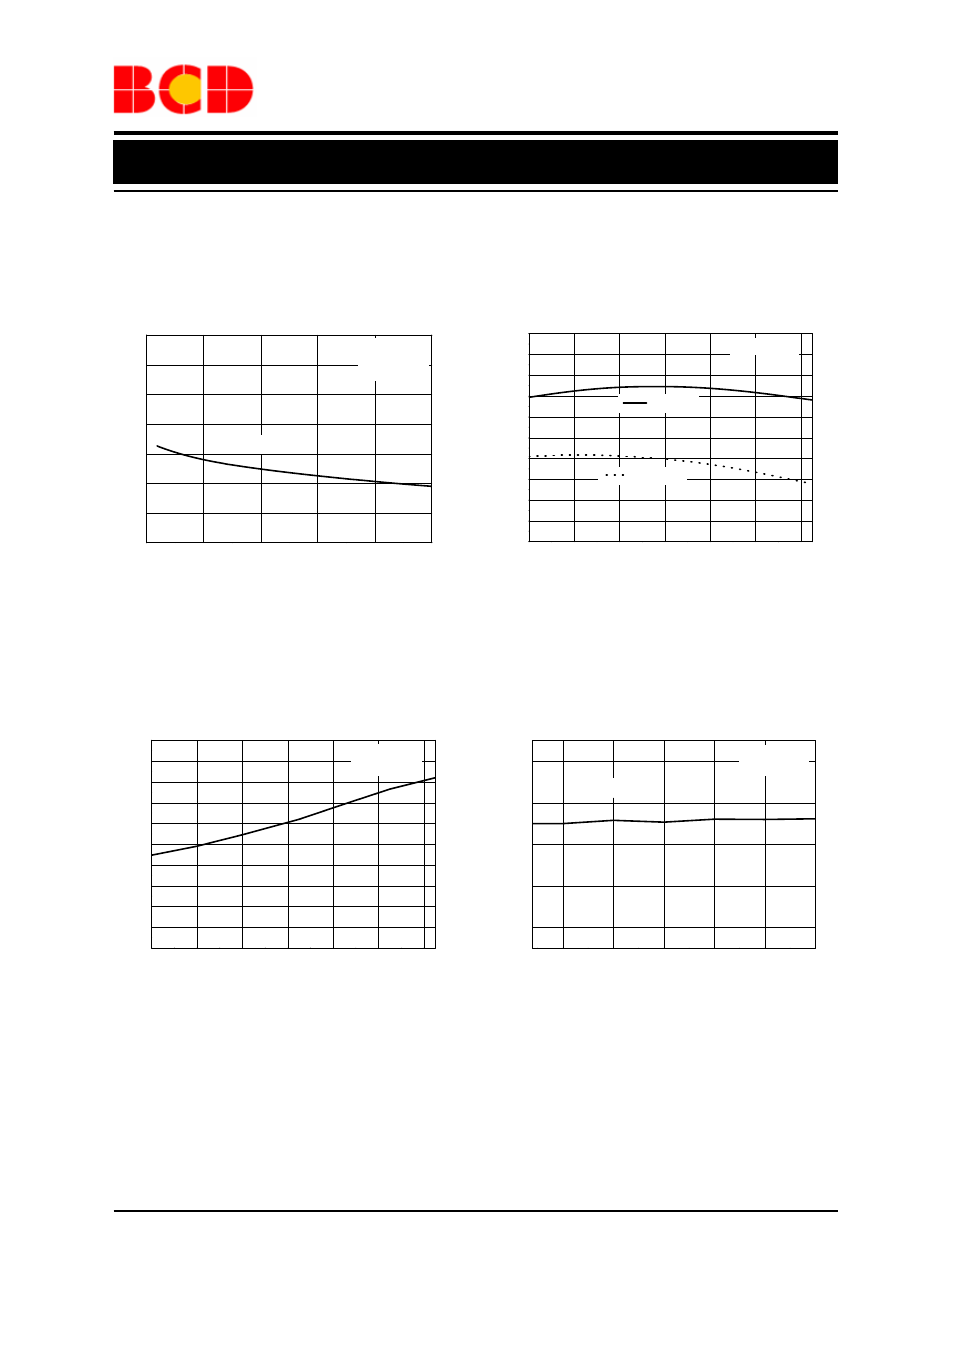
Typical Performance Characteristics (Continued)
Figure 12. Switch On Resistance vs. Supply Voltage Figure 13. UVLO Voltage vs. Ambient Temperature
Figure 14. Flag Delay Time during Over Current Figure 15. Flag Delay Time during Over Current
vs. Ambient Temperature vs. Supply Voltage
3.0
3.5
4.0
4.5
5.0
5.5
30
40
50
60
70
80
90
100
T
A
=25
O
C
Sw
it
ch
On
Re
s
ista
n
c
e
(m
Ω
)
Supply Voltage (V)
I
OUT
=2.0A
Enable Active
-40.0
-20.0
0.0
20.0
40.0
60.0
80.0
2.20
2.25
2.30
2.35
2.40
2.45
2.50
2.55
2.60
2.65
2.70
V
IN
Falling
Ambient Temperature (
O
C)
Enable Active
V
IN
Rising
Under
Volt
age Lo
ck
out
Thres
hold V
o
ltage
(V
)
-40.0
-20.0
0.0
20.0
40.0
60.0
80.0
5
6
7
8
9
10
11
12
13
14
15
V
IN
=5V
Enable Active
F
lag
D
e
la
y
T
ime
du
ring
O
v
e
r
Curr
ent
(
m
S
)
Ambient Temperature (
O
C)
3.0
3.5
4.0
4.5
5.0
5.5
6
8
10
12
14
T
A
=25
O
C
Supply Voltage (V)
V
IN
=5V
Enable Active
F
lag Delay
T
im
e
during
O
v
er Cu
rren
t (m
S
)